
I'm working on getting a radio test example project built for our custom board that is currently in production in order to perform some FCC testing, but I'm struggling to get any data in/out of the remote shell child application on the nrf5340 application core. Our network core is the NRF7002 and I've successfully established the IPC communication between those chips and verified communication. I'm successfully debugging using RTT on both the application and network core. I've verified that messages from the network core are triggering the TX uart callback, but I am unable to see any data on the pins using a logic analyzer (in analog mode to be safe). I'm suspecting some issue with the pin configuration, but I have double checked many times and I'm running out of ideas.
Our UART pins are as follows:
- TX: P01.04
- RX: P01.01
- CTS: P01.05
- RTS: P01.00
I've configured the uart0 pins in the same way in our (working) custom application as I am doing in an overlay file for our board in the remote_shell child image:
...
&uart0 {
   status = "okay";
   pinctrl-0 = <&uart0_default_alt>;
   pinctrl-1 = <&uart0_sleep_alt>;
   current-speed = <921600>;
   pinctrl-names = "default", "sleep";
};
...
&pinctrl {

   // Debug console UART Pins
   uart0_default_alt: uart0_default_alt {
      group1 {
         psels =  <NRF_PSEL(UART_TX, 1, 4)>,
                  <NRF_PSEL(UART_RTS, 1, 0)>;
      };
      group2 {
         psels =  <NRF_PSEL(UART_RX, 1, 1)>,
                  <NRF_PSEL(UART_CTS, 1, 5)>;
         bias-pull-up;
      };
   };
...
But I notice that the zephyr .dts file for the remote shell doesn't match:
our application .dts for application core:

		uart0_default_alt: uart0_default_alt {
			phandle = < 0x2 >;
			group1 {
				psels = < 0x24 >, < 0x40020 >;
			};
			group2 {
				psels = < 0x20021 >, < 0x60025 >;
				bias-pull-up;
			};
		};

the remote_shell .dts for application core:
		uart0_default_alt: uart0_default_alt {
			phandle = < 0x2 >;
			group1 {
				psels = < 0x24 >, < 0x20020 >;
			};
			group2 {
				psels = < 0x10021 >, < 0x30025 >;
				bias-pull-up;
			};
		};
		uart0_sleep_alt: uart0_sleep_alt {
			phandle = < 0x3 >;
			group1 {
				psels = < 0x24 >, < 0x20020 >;
				low-power-enable;
			};
			group2 {
				psels = < 0x10021 >, < 0x30025 >;
				bias-pull-up;
				low-power-enable;
			};
		};
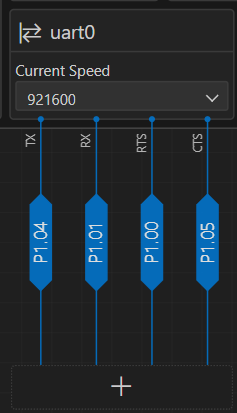
I know there's a visualization tool for the device tree, which also indicates that the UART0configuration matches.
our (working) app:
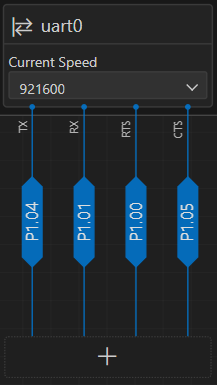
remote_shell application core
I must be missing something. I tried just copy/pasting the .dts output from the working into the remote_shell overlay file instead of the calls to `NRF_PSEL` into my source code, but when I did that the UART wasn't able to initialize and returned early from the call to determine if the UART is initialized:
	const struct device *dev = DEVICE_DT_GET(DT_CHOSEN(ncs_remote_shell_uart));

	...
	...

	if (!device_is_ready(dev)) {
		LOG_ERR("Device not ready");
		return 0;
	}
Any help would be greatly appreciated. I've included the sections of the code that seem relevant to the UART0 configuration, but let me know if there's something else I can send over that will help determine if the uart is configured correctly to send/recieve on the pins indicated above.
Thank you!

