Need help getting an nrf52810 to broadcast a ble signal

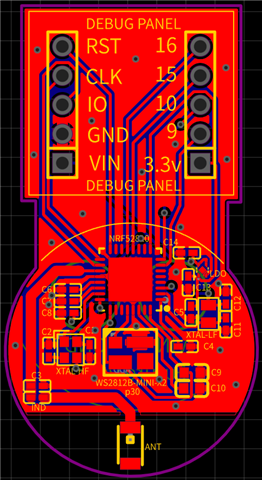
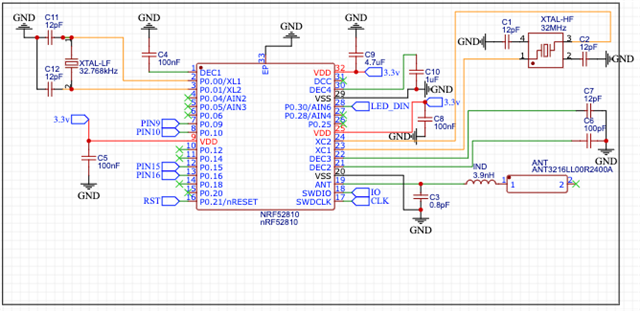
I'm working on a personal project and have designed and printed a small prototype board containing an nrf52810, external antenna, couple of crystals, and a ws2812b onboard, along with a handful of helpful breakout headers for programming and debugging

I can get GPIO working fine (I can toggle offboard leds on demand), and have full control over the ws2812b led, but every single attempt to get a working bluetooth (ble) signal broadcasting is failing. Sometimes the device is stack-overflowing, sometimes it's just erroring out, and sometimes it just ... doesn't say why it's not broadcasting. Note that as far as my circuit goes - I know that it likely isn't great, and won't result in amazing range or anything - I don't mind that as I only need _some_ range so I can test things.

Can someone take a look at the circuit and sample code and give me some insight into why this might not be playing ball? Every time I think it's broadcasting, I can't see the device when I scan using my iPhone and the nrf Connect mobile app.

Versions I'm using:

  • M2 Macbook Pro

  • `make` or `west build` both work for building the project

  • STLink V2 (a cheap chinese device running its latest firmware)

  • Openocd v0.12.0 (for flashing the chip - which works great)

  • SoftDevice s112 (v7.2.0) (only used when I'm building the examples from the old nRF5 SDK ... which also has this exact same problem of no signal being detected)

  • NCS v2.6.1

  • Zephyr v3.5.99 (bundled with ncs v2.6.1)

  • Device tree is very simple and is a custom board that extends `<nordic/nrf52810_qfaa.dtsi>` to enable a small handful things like `gpiote` and the `flash0` partitions

My board `defconfig` and project `prj.conf` files are pretty simple too, but I've attached a very simple `main.c` to show my workings so far.

Any help at all on this would be appreciated. Aside from help from friends in the know, I'm fully self taught on PCB design, component selection, and coding on this thing. Basically: I don't know what I don't know because I don't know anything.

#include <zephyr/kernel.h>
#include <zephyr/logging/log.h>
#include <zephyr/bluetooth/bluetooth.h>
#include <zephyr/drivers/gpio.h>

LOG_MODULE_REGISTER(main, CONFIG_LOG_DEFAULT_LEVEL);

#define DEVICE_NAME CONFIG_BT_DEVICE_NAME
#define DEVICE_NAME_LEN (sizeof(DEVICE_NAME) - 1)

#define LED_RED_NODE DT_ALIAS(led0)
#define LED_BLUE_NODE DT_ALIAS(led1)

static const struct gpio_dt_spec led_red = GPIO_DT_SPEC_GET(LED_RED_NODE, gpios);
static const struct gpio_dt_spec led_blue = GPIO_DT_SPEC_GET(LED_BLUE_NODE, gpios);

static void init_leds(void)
{
    gpio_pin_configure_dt(&led_red, GPIO_OUTPUT_ACTIVE);
    gpio_pin_configure_dt(&led_blue, GPIO_OUTPUT_ACTIVE);
}

static void flash_leds(int red, int blue, int msec_pause) {
    if (red > 0) gpio_pin_set_dt(&led_red, 1);
    if (blue > 0) gpio_pin_set_dt(&led_blue, 1);

    k_sleep(K_MSEC(msec_pause));

    if (red > 0) gpio_pin_set_dt(&led_red, 0);
    if (blue > 0) gpio_pin_set_dt(&led_blue, 0);

    k_sleep(K_MSEC(msec_pause / 2));
}

static const struct bt_data ad[] = {
    BT_DATA_BYTES(BT_DATA_FLAGS, BT_LE_AD_NO_BREDR),
    BT_DATA(BT_DATA_NAME_COMPLETE, DEVICE_NAME, DEVICE_NAME_LEN),

};

struct bt_data sd[] = {
    BT_DATA(BT_DATA_NAME_COMPLETE, DEVICE_NAME, DEVICE_NAME_LEN),
};

int main(void)
{
    int err;
    LOG_INF("App boot");

    init_leds();

    flash_leds(1, 1, 500);

    err = bt_enable(NULL);
    if (err) {
        LOG_ERR("Bluetooth init failed (err %d)", err);
        return -1;
    }
    LOG_INF("Bluetooth initialized");
    flash_leds(1, 1, 500);

    err = bt_le_adv_start(BT_LE_ADV_NCONN, ad, ARRAY_SIZE(ad), sd, ARRAY_SIZE(sd));
    if (err) {
        LOG_ERR("Advertising failed to start (err %d)", err);
        return -1;
    }
    LOG_INF("Advertising successfully started");
    flash_leds(1, 1, 500);
    flash_leds(1, 1, 500);

    while(1) {
        k_sleep(K_MSEC(500));
        flash_leds(0, 1, 500);
    }
}

  • Hi Daniel,

    Sometimes the device is stack-overflowing, sometimes it's just erroring out, and sometimes it just ... doesn't say why it's not broadcasting

    I am not a hardware engineer, so I would leave out the review part of the hardware for now (Even though a colleague of mine did a quick review and saw that your antenna is not routed correctly as you already mentioned in the original post)

    Stack overflows should not get influence from the hardware layout and schematics issues. I would like to get more details on these errors. What stack overflow are you getting? How often? Can we get some log trace? What is the context of the stack overflow? Is it causing hardfault exception? What does just erroring out mean? Please give more details for us to be able move into proper debugging direction.

  • Thanks for the response - I presume your colleague confirmed that while the routing may not be correct, it would still function (just not very well), yes? I hope so :)

    As for your ask - if I enable CONFIG_LOG_DEFAULT_LEVEL=4 I can reliably force a halt when using (or trying to use) BLE. Here's the output using the main.c I pasted in the original post:

    [00:00:00.250,21[00:00:00.250,488] <dbg> mpu: mpu_configure_region: Configure MPU region at index 0x2
    [00:00:00.250,488] <dbg> mpu: region_allocate_and_init: Program MPU region at index 0x2
    --- 10 messages dropped ---
    [00:00:00.250,518] <dbg> mpu: region_init: [2] 0x20004a00 0x150b000a
    [00:00:00.250,579] <dbg> os: setup_thread_stack: stack 0x200030c0 for thread 0x20000e08: obj_size=1368 buf_start=0x20003100 buf_size 1304 stack_ptr=0x20003618
    [00:00:00.250,640] <dbg> bt_hci_core: bt_hci_driver_register: Registered Controller
    [00:00:00.250,671] <dbg> os: k_sched_unlock: scheduler unlocked (0x200013f0:0)
    [00:00:00.250,671] <dbg> mpu: mpu_configure_region: Configure MPU region at index 0x2
    [00:00:00.250,701] <dbg> mpu: region_allocate_and_init: Program MPU region at index 0x2
    [00:00:00.250,732] <dbg> mpu: region_init: [2] 0x20004a00 0x150b000a
    [00:00:00.250,732] <inf> main: App boot
    [00:00:00.250,762] <dbg> os: z_tick_sleep: thread 0x200013f0 for 500 ticks
    [00:00:00.250,823] <dbg> mpu: mpu_configure_region: Configure MPU region at index 0x2
    [00:00:00.250,823] <dbg> mpu: region_allocate_and_init: Program MPU region at index 0x2
    [00:00:00.250,854] <dbg> mpu: region_init: [2] 0x200030c0 0x150b000a
    [00:00:00.250,885] <dbg> mpu: mpu_configure_region: Configure MPU region at index 0x2
    [00:00:00.250,915] <dbg> mpu: region_allocate_and_init: Program MPU region at index 0x2
    [00:00:00.250,946] <dbg> mpu: region_init: [2] 0x20002d80 0x150b000a
    [00:00:00.251,068] <err> os: ***** MPU FAULT *****
    [00:00:00.250,213] <dbg> mpu: mpu_configure_region: Configure MPU region at index 0x2
    [00:00:00.251,098] <err> os: Stacking error (context area might be not valid)
    [00:00:00.251,098] <err> os: Data Access Violation
    [00:00:00.251,129] <err> os: MMFAR Address: 0x20002db8
    [00:00:00.251,159] <err> os: r0/a1: 0xfdbe3fbf r1/a2: 0x5304038a r2/a3: 0xf95fff77
    [00:00:00.251,159] <err> os: r3/a4: 0x66115c20 r12/ip: 0xe9e337b7 r14/lr: 0x7a1daa09
    [00:00:00.251,190] <err> os: xpsr: 0xcd181000
    [00:00:00.251,220] <err> os: Faulting instruction address (r15/pc): 0x7e0ceb76
    [00:00:00.251,281] <err> os: >>> ZEPHYR FATAL ERROR 2: Stack overflow on CPU 0
    [00:00:00.251,312] <err> os: Current thread: 0x20000948 (unknown)
    [00:00:03.506,042] <err> os: Halting system

    If I leave log level at 4, but disable CONFIG_ARM_MPU and CONFIG_HW_STACK_PROTECTION, I get this repeating forever:

    <dbg> os: setup_thread_stack: stack 0x20004818 for thread 0x200013c0: obj_size=1024 buf_start=0x20004818 buf_size 1024 stack_ptr=0x20004c18
    [00:00:00.251,098] <dbg> os: z_impl_k_mutex_unlock: new owner of mutex 0x200007e4: 0 (prio: -1000)
    --- 40 messages dropped ---
    [00:00:00.252,441] <dbg> os: z_impl_k_mutex_lock: 0x20000948 took mutex 0x200007e4, count: 1, orig prio: 14
    --- 32 messages dropped ---
    [00:00:00.253,875] <dbg> os: z_impl_k_mutex_unlock: new owner of mutex 0x200007e4: 0 (prio: -1000)
    --- 28 messages dropped ---
    [00:00:00.255,096] <dbg> os: z_impl_k_mutex_lock: 0x20000948 took mutex 0x200007e4, count: 1, orig prio: 14
    --- 33 messages dropped ---
    [00:00:00.256,530] <dbg> os: z_impl_k_mutex_unlock: new owner of mutex 0x200007e4: 0 (prio: -1000)
    --- 29 messages dropped ---
    [00:00:00.257,751] <dbg> os: z_impl_k_mutex_unlock: mutex 0x200007e4 lock_count: 1���-7 messages dropped ---
    [00:00:00.331,298] <dbg> os: z_impl_k_mutex_lock: 0x20000948 took mutex 0x200007e4, count: 1, orig prio: 14
    --- 32 messages dropped ---
    [00:00:00.332,733] <dbg> os: z_impl_k_mutex_unlock: new owner of mutex 0x200007e4: 0 (prio: -1000)
    --- 28 messages dropped ---
    [00:00:00.333,923] <dbg> os: z_impl_k_mutex_lock: 0x20000948 took mutex 0x200007e4, count: 1, orig prio: 14
    --- 33 messages dropped ---
    [00:00:00.335,357] <dbg> os: z_impl_k_mutex_unlock: new owner of mutex 0x200007e4: 0 (prio: -1000)
    --- 29 messages dropped ---
    [00:00:00.336,608] <dbg> os: z_impl_k_mutex_unlock: mutex 0x200007e4 lock_count: 1
    --- 25 messages dropped ---
    [00:00:00.337,738] <dbg> os: z_impl_k_mutex_unlock: mutex 0x200007e4 lock_count: 1
    --- 27 messages dropped ---
    [00:00:00.338,836] <dbg> os: z_impl_k_mutex_lock: 0x20000948 took mutex 0x200007e4, count: 1, orig prio: 14���-
    --- 31 messages dropped ---
    [00:00:00.433,746] <dbg> os: z_impl_k_mutex_unlock: new owner of mutex 0x200007e4: 0 (prio: -1000)
    --- 28 messages dropped ---
    [00:00:00.434,936] <dbg> os: z_impl_k_mutex_lock: 0x20000948 took mutex 0x200007e4, count: 1, orig prio: 14
    --- 34 messages dropped ---
    [00:00:00.436,462] <dbg> os: z_impl_k_mutex_lock: 0x20000948 took mutex 0x200007e4, count: 1, orig prio: 14
    --- 31 messages dropped ---
    [00:00:00.437,774] <dbg> os: z_impl_k_mutex_unlock: new owner of mutex 0x200007e4: 0 (prio: -1000)
    ..... repeats forever

    If I then drop log level to 3:

    [00:00:00.250,274] <inf> main: App boot
    [00:00:00.987,670] <inf> bt_hci_core: HW Platform: Nordic Semiconductor (0x0002)
    [00:00:00.987,731] <inf> bt_hci_core: HW Variant: nRF52x (0x0002)
    [00:00:00.987,762] <inf> bt_hci_core: Firmware: Standard Bluetooth controller (0x00) Version 3.5 Build 99
    [00:00:00.988,433] <inf> bt_hci_core: Identity: FE:50:E7:18:3F:1A (random)
    [00:00:00.988,464] <inf> bt_hci_core: HCI: version 5.4 (0x0d) revision 0x0000, manufacturer 0x0059
    [00:00:00.988,494] <inf> bt_hci_core: LMP: version 5.4 (0x0d) subver 0xffff
    [00:00:00.988,494] <inf> main: Bluetooth initialized
    [00:00:01.724,243] <inf> main: Advertising successfully started
    ... no output after this point

    If I leave things at level 3 it really looks like it should be working (and the blue LED is flashing as expected too, thanks to the while loop) ... but I can see no broadcasted signal at all. It's baffling me.

  • Using "return -1;" in main() on error is generally going to fail, unlike (say) code on a Mac, which will defeat attempts to get logs; so perhaps replace those lines with a recognisable LED colour or sequence for each error in an infinite sleep loop. Doesn't help much perhaps, given that at the reduced log level it seems advertising does actually start.

    if (err) {
        LOG_ERR("Bluetooth init failed (err %d)", err);
        while(1) {
            k_sleep(K_MSEC(500));
            flash_leds(0, 1, 500); // <<== choose a recognisable colour or sequence for each error
        }
    }

  • danielhunt said:
    [00:00:00.251,220] <err> os: Faulting instruction address (r15/pc): 0x7e0ceb76
    [00:00:00.251,281] <err> os: >>> ZEPHYR FATAL ERROR 2: Stack overflow on CPU 0
    [00:00:00.251,312] <err> os: Current thread: 0x20000948 (unknown)
    [00:00:03.506,042] <err> os: Halting system

    I think it is key that we find out this context that caused the fault.

    As I mentioned in this thread, enable those configs and prestine build your app and get the logs again. This time we should get the Thread name that caused this error atleast. If you increase the thread stack size and test again, then maybe that will solve this issue.

  • Thanks Susheel - this isn't straightforward I'm afraid because of the nrf52810's low amount of memory (just 24KB)

    Whenever I enable CONFIG_ASSERT I end up with the same infinite loop of mutex_unlock messages I mentioned above.

    Without that, and with this set of flags enabled:

    # Debugging configuration
    CONFIG_THREAD_NAME=y
    CONFIG_THREAD_ANALYZER=y
    CONFIG_THREAD_ANALYZER_AUTO=y
    CONFIG_THREAD_ANALYZER_RUN_UNLOCKED=y
    CONFIG_THREAD_ANALYZER_USE_PRINTK=y

    # Add asserts
    CONFIG_ASSERT=y
    CONFIG_ASSERT_VERBOSE=y
    CONFIG_ASSERT_NO_COND_INFO=n
    CONFIG_ASSERT_NO_MSG_INFO=n
    # CONFIG_RESET_ON_FATAL_ERROR=n # not available on my chip
    CONFIG_THREAD_NAME=y
    CONFIG_STACK_SENTINEL=y

    ... I have the following output:

    [00:00:00.250,39[00:00:00.250,946] <dbg> mpu: region_allocate_and_init: Program MPU region at index 0x2
    [00:00:00.250,976] <dbg> mpu: region_init: [2] 0x20004f80 0x150b000a
    --- 11 messages dropped ---
    [00:00:00.251,037] <dbg> os: setup_thread_stack: stack 0x20003800 for thread 0x20000f18: obj_size=1368 buf_start=0x20003840 buf_size 1304 s
    tack_ptr=0x20003d58
    [00:00:00.251,342] <dbg> bt_hci_core: bt_hci_driver_register: Registered Controller
    [00:00:00.251,373] <dbg> os: setup_thread_stack: stack 0x20003080 for thread 0x20000948: obj_size=1088 buf_start=0x200030c0 buf_size 1024 stack_ptr=0x200034c0
    [00:00:00.251,617] <dbg> os: k_sched_unlock: scheduler unlocked (0x20001668:0)
    [00:00:00.251,617] <dbg> mpu: mpu_configure_region: Configure MPU region at index 0x2
    [00:00:00.251,647] <dbg> mpu: region_allocate_and_init: Program MPU region at index 0x2
    [00:00:00.251,678] <dbg> mpu: region_init: [2] 0x20004f80 0x150b000a
    [00:00:00.251,678] <inf> main: App boot
    [00:00:00.251,708] <dbg> os: z_tick_sleep: thread 0x20001668 for 500 ticks
    [00:00:00.251,770] <dbg> mpu: mpu_configure_region: Configure MPU region at index 0x2
    [00:00:00.251,800] <dbg> mpu: region_allocate_and_init: Program MPU region at index 0x2
    [00:00:00.251,800] <dbg> mpu: region_init: [2] 0x20003800 0x150b000a
    [00:00:00.251,861] <dbg> mpu: mpu_configure_region: Configure MPU region at index 0x2
    [00:00:00.251,861] <dbg> mpu: region_allocate_and_init: Program MPU region at index 0x2
    [00:00:00.251,892] <dbg> mpu: region_init: [2] 0x200034c0 0x150b000a
    [00:00:00.250,396] <dbg> mpu: mpu_configure_region: Configure MPU region at index 0x2
    [00:00:00.252,044] <err> os: ***** MPU FAULT *****
    [00:00:00.252,044] <err> os: Stacking error (context area might be not valid)
    [00:00:00.252,075] <err> os: Data Access Violation
    [00:00:00.252,075] <err> os: MMFAR Address: 0x200034f8
    [00:00:00.252,105] <err> os: r0/a1: 0x00000000 r1/a2: 0xe000ed00 r2/a3: 0x20001788
    [00:00:00.252,136] <err> os: r3/a4: 0x00000000 r12/ip: 0x200016d8 r14/lr: 0x0001f16b
    [00:00:00.252,136] <err> os: xpsr: 0x61000000
    [00:00:00.252,166] <err> os: Faulting instruction address (r15/pc): 0x000040a0
    [00:00:00.252,227] <err> os: >>> ZEPHYR FATAL ERROR 2: Stack overflow on CPU 0
    [00:00:00.252,288] <err> os: Current thread: 0x20000a10 (logging)
    [00:00:03.561,248] <err> os: Halting system

    And this is the output from GDB digging after the halt:

    (gdb) target remote localhost:3333
    Remote debugging using localhost:3333
    arch_system_halt (reason=reason@entry=2) at /opt/nordic/ncs/v2.6.1/zephyr/kernel/fatal.c:32
    32 for (;;) {
    (gdb)
    (gdb) bt full
    #0 arch_system_halt (reason=reason@entry=2) at /opt/nordic/ncs/v2.6.1/zephyr/kernel/fatal.c:32
    No locals.
    #1 0x00019b8c in k_sys_fatal_error_handler (reason=reason@entry=2, esf=esf@entry=0x20004e00 <z_interrupt_stacks+2048>)
    at /opt/nordic/ncs/v2.6.1/zephyr/kernel/fatal.c:46
    No locals.
    #2 0x00019c40 in z_fatal_error (reason=reason@entry=2, esf=esf@entry=0x20004e00 <z_interrupt_stacks+2048>)
    at /opt/nordic/ncs/v2.6.1/zephyr/kernel/fatal.c:122
    key = <optimized out>
    thread = 0x20000a10 <logging_thread>
    #3 0x00002aa8 in z_arm_fatal_error (reason=2, esf=0x20004e00 <z_interrupt_stacks+2048>,
    esf@entry=0x20004e10 <z_interrupt_stacks+2064>) at /opt/nordic/ncs/v2.6.1/zephyr/arch/arm/core/fatal.c:73
    No locals.
    #4 0x00002eb0 in z_arm_fault (msp=<optimized out>, psp=<optimized out>, exc_return=<optimized out>, callee_regs=<optimized out>)
    at /opt/nordic/ncs/v2.6.1/zephyr/arch/arm/core/cortex_m/fault.c:1157
    reason = <optimized out>
    fault = <optimized out>
    recoverable = false
    nested_exc = false
    esf = <optimized out>
    esf_copy = {basic = {{a1 = 0, r0 = 0}, {a2 = 3758157056, r1 = 3758157056}, {a3 = 536876936, r2 = 536876936}, {a4 = 0,
    r3 = 0}, {ip = 536876760, r12 = 536876760}, {lr = 127339, r14 = 127339}, {pc = 16544, r15 = 16544},
    xpsr = 1627389952}}
    #5 0x00002f80 in z_arm_usage_fault () at /opt/nordic/ncs/v2.6.1/zephyr/arch/arm/core/cortex_m/fault_s.S:102
    No locals.
    #6 <signal handler called>
    No symbol table info available.
    #7 0x2000354c in logging_stack ()
    No symbol table info available.
    warning: (Internal error: pc 0x2 in read in CU, but not in symtab.)
    warning: (Internal error: pc 0x2 in read in CU, but not in symtab.)
    warning: (Internal error: pc 0x0 in read in CU, but not in symtab.)
    warning: (Internal error: pc 0x1 in read in CU, but not in symtab.)
    warning: (Internal error: pc 0x1 in read in CU, but not in symtab.)
    warning: (Internal error: pc 0x1 in read in CU, but not in symtab.)
    warning: (Internal error: pc 0x1 in read in CU, but not in symtab.)
    #8 0x00000002 in cbprintf_package (packaged=<optimized out>, len=<optimized out>, flags=<optimized out>, warning: (Internal error: pc 0x1 in read in CU, but not in symtab.)
    warning: (Internal error: pc 0x1 in read in CU, but not in symtab.)
    warning: (Internal error: pc 0x0 in read in CU, but not in symtab.)
    warning: (Internal error: pc 0x1 in read in CU, but not in symtab.)
    warning: (Internal error: pc 0x1 in read in CU, but not in symtab.)
    warning: (Internal error: pc 0x1 in read in CU, but not in symtab.)
    warning: (Internal error: pc 0x1 in read in CU, but not in symtab.)
    warning: (Internal error: pc 0x1 in read in CU, but not in symtab.)
    format=warning: (Internal error: pc 0x1a in read in CU, but not in symtab.)

    0x1a <cbprintf_package+26> "")
    warning: (Internal error: pc 0x1 in read in CU, but not in symtab.)
    warning: (Internal error: pc 0x1 in read in CU, but not in symtab.)
    ap = warning: (Internal error: pc 0x1 in read in CU, but not in symtab.)
    {__ap = 0x2000074c <log_buffer>}
    ret = <optimized out>
    warning: (Internal error: pc 0x1 in read in CU, but not in symtab.)
    Backtrace stopped: previous frame identical to this frame (corrupt stack?)
    (gdb) x/32x 0x200034f8
    0x200034f8 <logging_stack+56>: 0x000040a0 0x61000000 0x00000002 0x2000074c
    0x20003508 <logging_stack+72>: 0x00000008 0x0001c515 0x2000074c 0x00000002
    0x20003518 <logging_stack+88>: 0x2000354c 0x2000074c 0x0000001a 0x0000000c
    0x20003528 <logging_stack+104>: 0x00000000 0x00000020 0x00000000 0x00000000
    0x20003538 <logging_stack+120>: 0x00000020 0x0001c717 0x00000000 0xaaaaaaaa
    0x20003548 <logging_stack+136>: 0xaaaaaaaa 0x00000000 0x00000002 0x00000000
    0x20003558 <logging_stack+152>: 0xaaaaaaaa 0x00000000 0x00003900 0x00000000
    0x20003568 <logging_stack+168>: 0x20003590 0x0000001c 0x200035f8 0x0000000a
    (gdb) x/i 0x000040a0
    0x40a0 <hci_num_completed_packets+372>: b.n 0x408a <hci_num_completed_packets+350>
    (gdb) quit
Related