High power consumption with Distance Measurement enabled (when not active)

Hi,

We are experimenting with Distance Measurement feature a we observed 2 issues.

HW: Custom HW with: CR2032 coin cell -> joulescope -> 40 uF capacity in ceramic caps -> BL652 (nrf52832) module from Ezurio.

SW: NRF connect SDK 2.7.0, custom toolchain (gcc 14.1). Simple app is using extended advertising and distance measurement is enabled.

  • DCDC enabled
  • CONFIG_PM=y
  • CONFIG_PM_DEVICE=y
  • CONFIG_DM_MODULE=y
  • CONFIG_DM_RANGING_OFFSET_US=10000
  • CONFIG_DM_INITIATOR_DELAY_US=1000
  • only GPIOs enabled

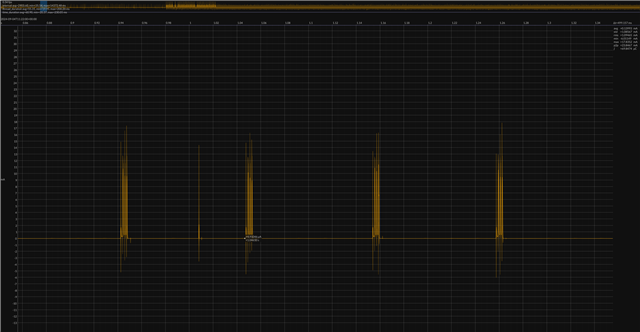
Higher power consumption During advertising than online profiler expects

Screenshot from joulescope, average power consumption is around 92 uA (top right corner). No DM activity here.

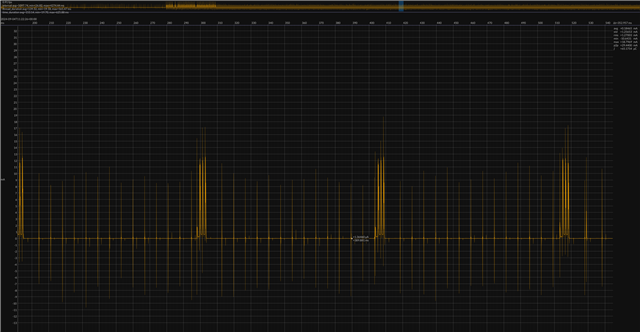
Increased power consumption after distance measurement

When we make power on reflector and several distance measurement are made, power consumption never returns to original value.

To me, it looks like MPSL is started with first DM and then keeps waking MCU even though there is no need for more scheduling.

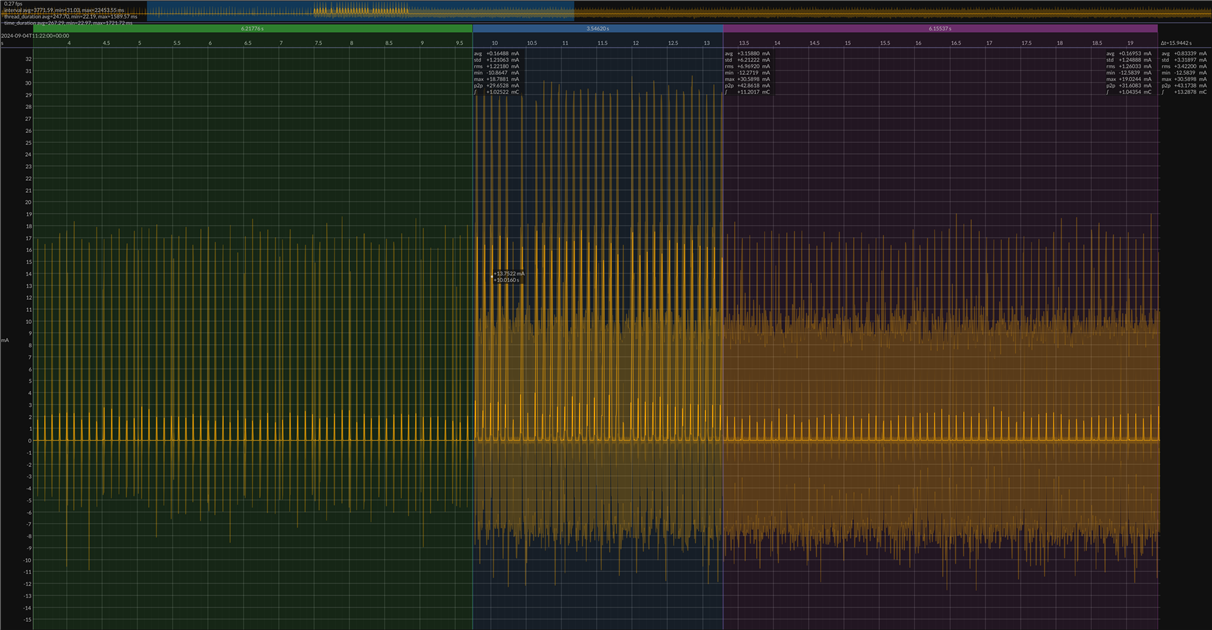
Green - advertising before DM

Blue - advertising + DM

Purple - advertising after DM

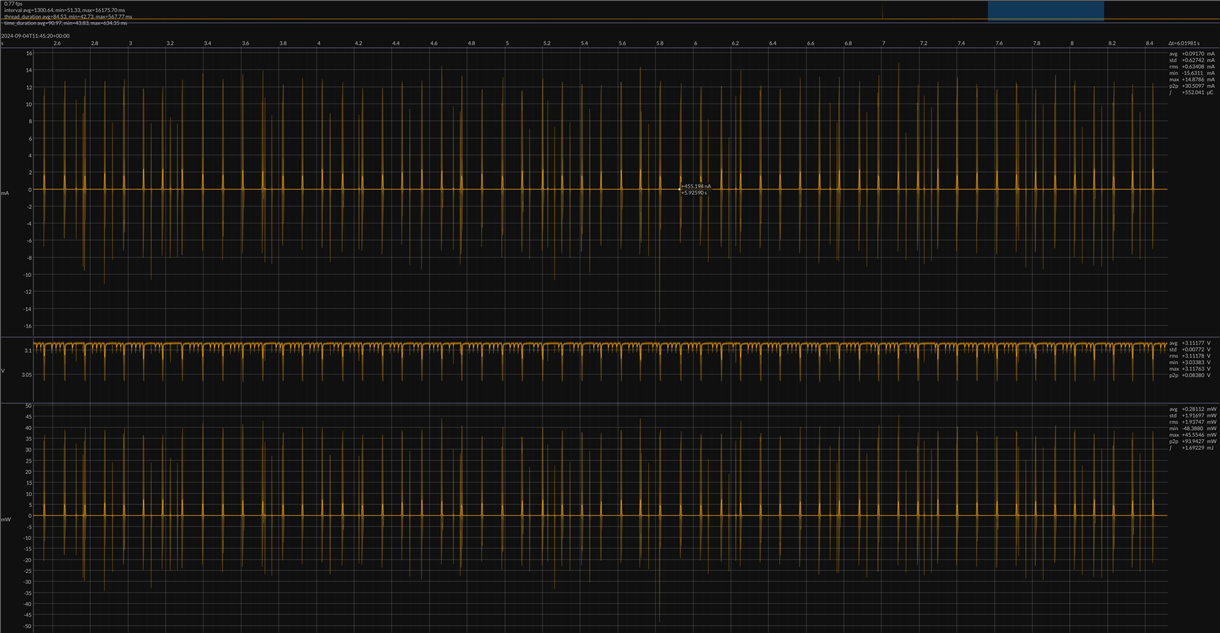
Details of advertising before and after DM (ignore slightly different time scale)

  • Hi

    It's a bit hard to tell from these screenshots, but my guess is that these extra spikes you're seeing is the synchronization between the advertiser and the scanner as well as Distance Measurement that is occurring, since the Distance Measurement Toolbox uses synchronization between devices to do the Distance Measurements. This is something the Online Power Profiler does not take into account and so I think that's what we're seeing on your end here. If you'd like I can try to set up a DM sample with power measurements on my end next week to confirm this behavior.

    Best regards,

    Simon

  • Hi Simonr,

    I simplified my code as much as I could:

    - BLE is not even initialized (thus neither DM)

    - main function/thread only contains k_thread_suspend(k_current_get());

    and those periodic current spikes are still there. Joulescope shows 19.999 ms between them. What is the default source of timing in zephyr on nrf52(832)? Could it be overflow of some HW timer user for time keeping? Logging and printing is disabled via Kconfig.

    Only default threads are there:

    Address     Name      Status  Priority Stack Usage % (Used B / Size B)  
    0x20001ad8  BT LW WQ  PRESTART   10    13 % (168 / 1304)
    0x200027b0  MPSL Work PRESTART   246   16 % (168 / 1024)
    0x200028d8  idle      RUNNING    15    10 % ( 32 / 320)
    0x200029e0  main      SUSPENDED  0     16 % (160 / 1024)
    0x20002ae8  sysworkq  PRESTART   255    8 % (168 / 2048)

    How can I debug this?

    These spikes result in average consumption of 30 uA.

  • Ok, after physically disconnecting debugger, it got better. There are still still some spikes, but only 1 after each advertising and if there is not adverting, no current spikes at all. I thought that J-link in detached state is inert, but obviously not.

    I have to get a rubber duck for my future debugging Sweat smile.

Related