Thread viewer empty during debug

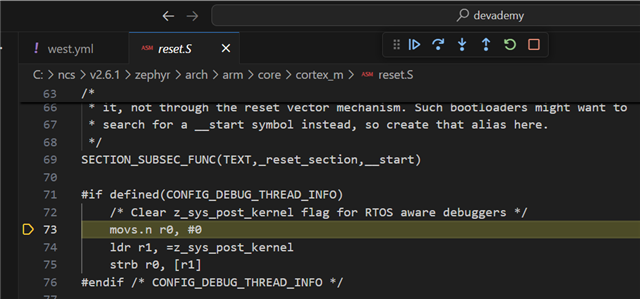
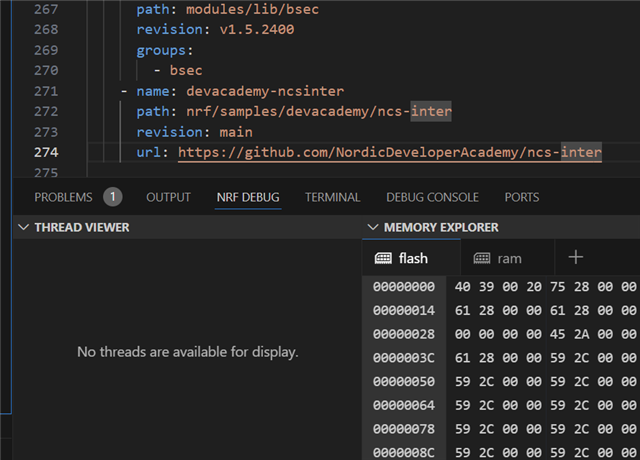
I have two computers where nRF Connect for VSCode behaves differently in the sense that in one computer when I start debug it stops at the first line of the main and I see thread viewer correctly showing the threads and the other computer stops first in the debug at some setup or init script and not in the main. In addition the Thread Viewer is empty.

I use nRF Connect SDK 2.6.1 from c:\ncs\v2.6.1\nrf\west.yml

I did some cleanup by removing VSCode, Segger probe softwares, nRF Connect for Desktop and tools. Then I searched in Windows in %USERPROFILE% and %APPDATA% Local and Roaming anything I could find related to nRF, VSCode, Segger tools. Then I reinstalled and I use a shared profile and the same nRF52840DK board. In the profile is installed nRF Connect for VSCode Extension Pack, which in turn install what is needed.

Despite repeating the same cleanup  and setup, in the home computer it works, and in the workplace doesn't.

I have a feeling that there are some hidden configs which I don't know, therefore is not enough to uninstall and cleanup in  %USERPROFILE% and %APPDATA% .

I really wished to have reliable and repeatable setup. Does anybody where it is saved the configuration regarding where it stops first at the staring point of Debug session?

Where exactly have to be made manual cleanup, to completely reset the developer environment?

Parents
  • I repeated one more time the entire cleanup. At this time I removed all the python installs. The results are the same. Thread Viewer is always empty.

    The first line of code when the debugger starts is here.

    In my other machine it stops at main().

    I can still add breakpoints and stops correctly, but the Thread Viewer is empty

    As you see, in the C:\ncs\v2.6.1\nrf\west.yml I added "devacademy-ncsinter" external repo and than created a new project by copying Lesson 1 with solution (inter_less1_exer1_solution_1)

    prj.conf has these lines

    CONFIG_GPIO=y
    CONFIG_LOG=y

    # STEP 1 - Enable debugging
    CONFIG_DEBUG_THREAD_INFO=y
    CONFIG_DEBUG_OPTIMIZATIONS=y
    .vscode\settings.json has only these
    {
        "nrf-connect.applications": [
            "${workspaceFolder}\\inter_less1_exer1_solution_1"
        ]
    }
Reply
  • I repeated one more time the entire cleanup. At this time I removed all the python installs. The results are the same. Thread Viewer is always empty.

    The first line of code when the debugger starts is here.

    In my other machine it stops at main().

    I can still add breakpoints and stops correctly, but the Thread Viewer is empty

    As you see, in the C:\ncs\v2.6.1\nrf\west.yml I added "devacademy-ncsinter" external repo and than created a new project by copying Lesson 1 with solution (inter_less1_exer1_solution_1)

    prj.conf has these lines

    CONFIG_GPIO=y
    CONFIG_LOG=y

    # STEP 1 - Enable debugging
    CONFIG_DEBUG_THREAD_INFO=y
    CONFIG_DEBUG_OPTIMIZATIONS=y
    .vscode\settings.json has only these
    {
        "nrf-connect.applications": [
            "${workspaceFolder}\\inter_less1_exer1_solution_1"
        ]
    }
Children
  • Since I couldn't solve the problem of nRF Debug to show threads in my usual user account in the PC at my workspace, I decided to create a new local user account in the same PC and specially I take care to not have space character in user folder name.
    I reinstalled nRF Connect for Desktop, the nRF connect command line tools, VSCode. VSCode I enabled cloud sync to pull down my previously installed profiles and extensions. nRF Connect for VSCode extensions are installed in a profile, just to not mix with other extensions.
    In this newly created account now nRF Debug and Thread Viewer works correctly. and in the extension host logs I don't have this  "[error] CodeExpectedError: stackTrace: property 'threadId' is invalid." log.  I still have "[error] TypeError: Cannot read properties of undefined (reading 'dispose')" . For the details of the stacktrace, you can search above.

    The chances are high that nRF Debug extension, specifically the thread viewer is sensible to spaces in the user folder name. I cannot fully guarantee that this was the exact cause of the problem, since this new user at least is more cleaner. since it was just created.

    For positive test, i let someone freshly create a new windows 11 user account with space character in the folder name and do the setup there. If the thread viewer will be empty, than we know the exact cause. If not the space character in the user folder is the real cause, then when somebody else has this issue, at least there is a workaround... just create a new local user account.  Of course I cannot fully support this type of advice, since it is a hassle to setup everything again in the new user account.

Related