How to debug a stack overflow error in a nRF5340

I am getting this error on the 7th time I perform an action:

[00:02:31.772,277] <err> lvgl: (151.772, +67506)         lv_mem_realloc: couldn't allocate memory       (in lv_mem.c line #211)
[00:02:31.772,521] <err> lvgl: (151.772, +0)     lv_mem_buf_get: Asserted at expression: buf != NULL (Out of memory, can't allocate a new buffer (increase your LV_MEM_SIZE/heap size))   (in lv_mem.c line #312)

I understand it's an lvgl error and could be specific to lvgl but I think, considering it's only happening on the 7th time I perform an action, that it's a memory problem someplace else. I was thinking being able to print the available RAM would help. Is there a way to do that? Is there a way to see what variables are in RAM?

I'm using Zephyr with the VSC connect add-in.

Parents
  • Hello,

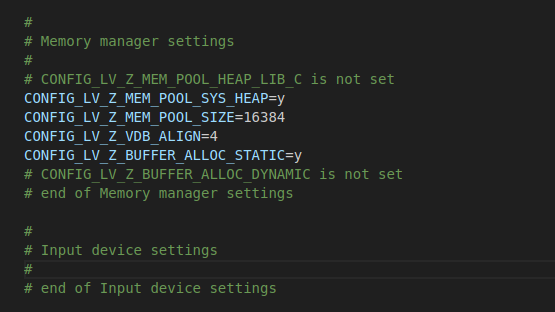
    Please check which memory configs you have for LVGL in your .config file (located in build/zephyr/ for SDK v2.6.x and below, or build/<app name>/zephyr for SDK v2.7.0 and above).

    Below are the default configurations I got when I built the LVGL sample in SDK v2.7.0. Here it is using Zephyr heap and 16K. It would be interesting to know if you can run more iterations if you increase the mem pool size in your project configuration.

    Best regards,

    Vidar

  • As you were able to run more iterations by increasing the memory pool it suggests that some objects allocated from heap are not being freed after use with lv_mem_free(). It is possible to monitor the heap usage. However, we already know that the heap is being used up. 

    Are you able to reproduce this with the original LVGL sample in the SDK?

  • I am not able to replicate it with the sample. I started with the sample, but it didn't have all the capabilities I needed for the overall app. Could the heap be used up by a different process or is it likely to be lvgl? When I change the CONFIG_LV_Z_MEM_POOL_SIZE from 16384 to 32768 it happens around the 23rd time vs 8th time. Does that help isolate the problem?

  • The heap allocated by CONFIG_LV_Z_MEM_POOL_SIZE is reserved to the lvgl, and is not used by other modules. Since you are not seeing this with the sample code, I think it makes sense to review how you are using the library in your application.  

    Here is an example I found where incorrect API usage led to a memory leak: https://github.com/lvgl/lvgl/issues/2240 

  • Thank you. I will review the sample in the link you provided. I used the sample code to get started but in real world applications the usage of lvgl is likely to be different. For example, they don't show how to switch screens in the example, but that is a common use case. Additionally, they don't show how to display images from files in the sample, but it is a feature of lvgl. I think what I am looking to understand is how to debug the issue when it happens. My initial thought was printing the RAM to narrow down where it might be happening. I could use Nordic debugging tools but don't have the RAM tab for some reason. Is there something you would do at this point given that the code has evolved far beyond the sample?

  • Yes, the sample applications typically serve only as a starting point. I just wanted to confirm that you did not experience this issue with the provided sample. I'm not very familiar with the LVGL API myself, but based on what you've described, it seems that the problem is likely due to new LVGL objects being created continuously in your application without deleting old objects that are no longer needed. Similar to the issue described in the linked github issue.

    You can find more LVGL examples in /modules/lib/gui/lvgl/examples and /modules/lib/gui/lvgl/demos. While these won’t build out of the box with Zephyr, they do demonstrate how the API is meant to be used.

    lcj said:
    I could use Nordic debugging tools but don't have the RAM tab for some reason.

    From the screenshot you posted in the other thread, it seems you were able to view it after pausing the debugger? That said, I don’t think inspecting the RAM content will help you troubleshoot this particular issue. I recommend focusing on reviewing the API usage in your application and ensuring that objects are freed (deleted) after use.

    EDIT: I see what you mean now. The Memory Explorer view is not showing the RAM tab as shown in the picture from the devacademy course. Instead, it displays the program sections: .text, .rodata, and .data where .data is equivalent to the previous RAM tab.

Reply
  • Yes, the sample applications typically serve only as a starting point. I just wanted to confirm that you did not experience this issue with the provided sample. I'm not very familiar with the LVGL API myself, but based on what you've described, it seems that the problem is likely due to new LVGL objects being created continuously in your application without deleting old objects that are no longer needed. Similar to the issue described in the linked github issue.

    You can find more LVGL examples in /modules/lib/gui/lvgl/examples and /modules/lib/gui/lvgl/demos. While these won’t build out of the box with Zephyr, they do demonstrate how the API is meant to be used.

    lcj said:
    I could use Nordic debugging tools but don't have the RAM tab for some reason.

    From the screenshot you posted in the other thread, it seems you were able to view it after pausing the debugger? That said, I don’t think inspecting the RAM content will help you troubleshoot this particular issue. I recommend focusing on reviewing the API usage in your application and ensuring that objects are freed (deleted) after use.

    EDIT: I see what you mean now. The Memory Explorer view is not showing the RAM tab as shown in the picture from the devacademy course. Instead, it displays the program sections: .text, .rodata, and .data where .data is equivalent to the previous RAM tab.

Children
No Data
Related