HI guys, I'm trying to figure out whether the problem I'm having is a hardware or software issue.
So, my problem is: I have created a custom board using the nrf5340 and I'm debugging the hardware/software now. It's a basic PCB with USB and FEM.
In the part of USB, everything worked fine, and I can access the hardware through the USB using the `CDC USB`.
But when I tried to run this sample [openthread/cli](`https://github.com/nrfconnect/sdk-nrf/tree/main/samples/openthread/cli`) and used the command `ot scan` it got stuck and I can't send more to the terminal commands using `ot`.
Then I decided to add the following Kconfigs in my project to see what happened:
```
CONFIG_OPENTHREAD_LOG_LEVEL_DEBG=y
CONFIG_OPENTHREAD_DEBUG=y
CONFIG_OPENTHREAD_L2_DEBUG=y
```
and the output in the terminal was:
```sh
[00:00:00.348,175] <inf> ieee802154_nrf5: nRF5 802154 radio initialized
[00:00:00.354,644] <inf> fs_nvs: 8 Sectors of 4096 bytes
[00:00:00.354,644] <inf> fs_nvs: alloc wra: 0, fd0
[00:00:00.354,644] <inf> fs_nvs: data wra: 0, 70
[00:00:00.356,079] <dbg> [D] SubMac--------: RadioState: Disabled -> Sleep
[00:00:00.359,649] <dbg> [D] SubMac--------: RadioExtAddress: d223be944a906d83
[00:00:00.360,015] <dbg> [D] SubMac--------: RadioShortAddress: 0xfffe
[00:00:00.360,626] <dbg> [D] SrcMatchCtrl--: Cleared all entries
[00:00:05.381,530] <inf> cli_sample:
OpenThread Command Line Interface is now running.
Use the 'ot' keyword to invoke OpenThread commands e.g. 'ot thread start.'
For the full commands list refer to the OpenThread CLI documentation at:
github.com/.../README.md
uart:~$ ot scan
| PAN | MAC Address | Ch | dBm | LQI |
+------+------------------+----+-----+-----+
[00:00:09.638,732] <dbg> [D] Mac-----------: Request to start operation "ActiveScan"
[00:00:09.638,885] <dbg> [D] Mac-----------: Starting operation "ActiveScan"
[00:00:09.639,434] <dbg> [D] SubMac--------: RadioPanId: 0xffff
[00:00:09.639,556] <inf> [I] Mac-----------: Sending Beacon Request
[00:00:09.639,678] <dbg> [D] SubMac--------: RadioState: Sleep -> CsmaBackoff
[00:00:09.639,801] <dbg> [D] SubMac--------: RadioState: CsmaBackoff -> Transmit
uart:~$
```
Ok, is something weird happening here...It gets stuck when I try to transmit the signal, and if we see the datasheet of the (nrf5340 v1.5)[https://docs.nordicsemi.com/bundle/ps_nrf5340/page/chapters/soc_overview/doc/instantiation.html] says:
```
The application core peripherals are accessible from the network core, but the network core peripherals are not accessible from the application core.
```
I guess the problem is related to the IPC. Somehow, the application core tries to send the transmission to the network core, and neither the network core nor the application core receives the request or the response.
So, I tried to use the [ipc service sample](https://docs.nordicsemi.com/bundle/ncs-2.6.1/page/nrf/samples/ipc/ipc_service/README.html) to see if the problem is it. The following are the results of `rpmsg_cpuapp_sending` and `icmsg_cpuapp_sending` using just one core:
APP CORE (RPMSG)
Command:
west build -p -b unny/nrf5340/cpuapp -T sample.ipc.ipc_service.unny_rpmsg_cpuapp_sending .
```
*** Booting nRF Connect SDK v2.9.0-7787b2649840 ***
*** Using Zephyr OS v3.7.99-1f8f3dc29142 ***
IPC-service unny/nrf5340/cpuapp demo started
Δpkt: 43032 (100 B/pkt) | throughput: 34425600 bit/s
Δpkt: 43004 (100 B/pkt) | throughput: 34403200 bit/s
Δpkt: 43056 (100 B/pkt) | throughput: 34444800 bit/s
Δpkt: 43009 (100 B/pkt) | throughput: 34407200 bit/s
Δpkt: 43004 (100 B/pkt) | throughput: 34403200 bit/s
Δpkt: 42994 (100 B/pkt) | throughput: 34395200 bit/s
Δpkt: 42990 (100 B/pkt) | throughput: 34392000 bit/s
Δpkt: 43005 (100 B/pkt) | throughput: 34404000 bit/s
Δpkt: 43002 (100 B/pkt) | throughput: 34401600 bit/s
Δpkt: 42998 (100 B/pkt) | throughput: 34398400 bit/s
```
NET CORE (RPMSG)
```
*** Booting nRF Connect SDK v2.9.0-7787b2649840 ***
*** Using Zephyr OS v3.7.99-1f8f3dc29142 ***
IPC-service unny/nrf5340/cpunet demo started
[00:00:00.516,967] <inf> sync_rtc: Updated timestamp to synchronized RTC by 8300 ticks (253295us)
Δpkt: 1 (100 B/pkt) | throughput: 800 bit/s
Δpkt: 0 (100 B/pkt) | throughput: 0 bit/s
Δpkt: 0 (100 B/pkt) | throughput: 0 bit/s
Δpkt: 0 (100 B/pkt) | throughput: 0 bit/s
Δpkt: 0 (100 B/pkt) | throughput: 0 bit/s
Δpkt: 0 (100 B/pkt) | throughput: 0 bit/s
Δpkt: 0 (100 B/pkt) | throughput: 0 bit/s
Δpkt: 0 (100 B/pkt) | throughput: 0 bit/s
Δpkt: 0 (100 B/pkt) | throughput: 0 bit/s
Δpkt: 0 (100 B/pkt) | throughput: 0 bit/s
Δpkt: 0 (100 B/pkt) | throughput: 0 bit/s
Δpkt: 0 (100 B/pkt) | throughput: 0 bit/s
```
APP CORE (ICMSG)
Command:
west build -p -b unny/nrf5340/cpuapp -T sample.ipc.ipc_service.unny_icmsg_cpuapp_sending .
```
*** Booting nRF Connect SDK v2.9.0-7787b2649840 ***
*** Using Zephyr OS v3.7.99-1f8f3dc29142 ***
IPC-service unny/nrf5340/cpuapp demo started
```
NET CORE (ICMSG)
```
*** Booting nRF Connect SDK v2.9.0-7787b2649840 ***
*** Using Zephyr OS v3.7.99-1f8f3dc29142 ***
IPC-service unny/nrf5340/cpunet demo started
[00:00:06.300,170] <inf> sync_rtc: Updated timestamp to synchronized RTC by 103052 ticks (3144897us)
```
Building now just to cpunet sending the data. It is obtained:
APP CORE (ICMSG)
Command:
west build -p -b unny/nrf5340/cpuapp -T sample.ipc.ipc_service.unny_icmsg_cpunet_sending .
```
*** Booting nRF Connect SDK v2.9.0-7787b2649840 ***
*** Using Zephyr OS v3.7.99-1f8f3dc29142 ***
IPC-service unny/nrf5340/cpuapp demo started
```
NET CORE (ICMSG)
```
*** Booting nRF Connect SDK v2.9.0-7787b2649840 ***
*** Using Zephyr OS v3.7.99-1f8f3dc29142 ***
IPC-service unny/nrf5340/cpunet demo started
[00:00:03.351,257] <inf> sync_rtc: Updated timestamp to synchronized RTC by 54737 ticks (1670440us)
```
APP CORE (RPMSG)
Command:
west build -p -b unny/nrf5340/cpuapp -T sample.ipc.ipc_service.unny_rpmsg_cpunet_sending .
```
*** Booting nRF Connect SDK v2.9.0-7787b2649840 ***
*** Using Zephyr OS v3.7.99-1f8f3dc29142 ***
IPC-service unny/nrf5340/cpuapp demo started
Δpkt: 1 (100 B/pkt) | throughput: 800 bit/s
Δpkt: 0 (100 B/pkt) | throughput: 0 bit/s
Δpkt: 0 (100 B/pkt) | throughput: 0 bit/s
Δpkt: 0 (100 B/pkt) | throughput: 0 bit/s
Δpkt: 0 (100 B/pkt) | throughput: 0 bit/s
```
NET CORE (RPMSG)
```
*** Booting nRF Connect SDK v2.9.0-7787b2649840 ***
*** Using Zephyr OS v3.7.99-1f8f3dc29142 ***
IPC-service unny/nrf5340/cpunet demo started
[00:00:00.516,967] <inf> sync_rtc: Updated timestamp to synchronized RTC by 8300 ticks (253295us)
Δpkt: 33643 (100 B/pkt) | throughput: 26914400 bit/s
Δpkt: 33669 (100 B/pkt) | throughput: 26935200 bit/s
Δpkt: 33686 (100 B/pkt) | throughput: 26948800 bit/s
Δpkt: 33684 (100 B/pkt) | throughput: 26947200 bit/s
Δpkt: 33688 (100 B/pkt) | throughput: 26950400 bit/s
Δpkt: 33692 (100 B/pkt) | throughput: 26953600 bit/s
```
Ok, removing the fact that the ICMSG is showing no logs, the CPUs using the RPMSG are working. Now let’s set to default the build to both application and network cores periodically print out the receiving speed of data that was sent by the other core.
When I use the icmsg_default in my build the APP and NET logs:
APP CORE (ICMSG)
```sh
*** Booting nRF Connect SDK v2.9.0-7787b2649840 ***
*** Using Zephyr OS v3.7.99-1f8f3dc29142 ***
IPC-service unny/nrf5340/cpuapp demo started
```
NET CORE (ICMSG)
```sh
*** Booting nRF Connect SDK v2.9.0-7787b2649840 ***
*** Using Zephyr OS v3.7.99-1f8f3dc29142 ***
IPC-service unny/nrf5340/cpunet demo started
[00:00:00.516,387] <inf> sync_rtc: Updated timestamp to synchronized RTC by 8290 ticks (252990us)
```
and nothing more happens.
Building it now to rpmsg_default I receive:
APP CORE (RPMSG)
```
*** Booting nRF Connect SDK v2.9.0-7787b2649840 ***
*** Using Zephyr OS v3.7.99-1f8f3dc29142 ***
IPC-service unny/nrf5340/cpuapp demo started
Δpkt: 33 (100 B/pkt) | throughput: 26400 bit/s
Δpkt: 0 (100 B/pkt) | throughput: 0 bit/s
Δpkt: 0 (100 B/pkt) | throughput: 0 bit/s
Δpkt: 0 (100 B/pkt) | throughput: 0 bit/s
Δpkt: 0 (100 B/pkt) | throughput: 0 bit/s
```
NET CORE (RPMSG)
```
*** Booting nRF Connect SDK v2.9.0-7787b2649840 ***
*** Using Zephyr OS v3.7.99-1f8f3dc29142 ***
IPC-service unny/nrf5340/cpunet demo started
[00:00:00.516,845] <inf> sync_rtc: Updated timestamp to synchronized RTC by 8298 ticks (253234us)
Δpkt: 9255 (100 B/pkt) | throughput: 7404000 bit/s
Δpkt: 9738 (100 B/pkt) | throughput: 7790400 bit/s
Δpkt: 9929 (100 B/pkt) | throughput: 7943200 bit/s
Δpkt: 9928 (100 B/pkt) | throughput: 7942400 bit/s
Δpkt: 9931 (100 B/pkt) | throughput: 7944800 bit/s
Δpkt: 9928 (100 B/pkt) | throughput: 7942400 bit/s
Δpkt: 9932 (100 B/pkt) | throughput: 7945600 bit/s
Δpkt: 9928 (100 B/pkt) | throughput: 7942400 bit/s
Δpkt: 9928 (100 B/pkt) | throughput: 7942400 bit/s
```
seems close to [the sample log](https://docs.nordicsemi.com/bundle/ncs-2.6.1/page/nrf/samples/ipc/ipc_service/README.html) removing the part that my APP Core is sending nothing.
The only way to get the log similar to the one in the website is using the solution found https://devzone.nordicsemi.com/f/nordic-q-a/97387/sample-ipc_service-failed-in-ncs-v2-3-0 where it increase the interval that the IPC service send the interval to 20ms.
APP CORE (RPMSG)
```
*** Booting nRF Connect SDK v2.9.0-7787b2649840 ***
*** Using Zephyr OS v3.7.99-1f8f3dc29142 ***
IPC-service unny/nrf5340/cpuapp demo started
Δpkt: 50 (100 B/pkt) | throughput: 40000 bit/s
Δpkt: 50 (100 B/pkt) | throughput: 40000 bit/s
Δpkt: 50 (100 B/pkt) | throughput: 40000 bit/s
Δpkt: 49 (100 B/pkt) | throughput: 39200 bit/s
Δpkt: 50 (100 B/pkt) | throughput: 40000 bit/s
```
NET CORE (RPMSG)
```
*** Booting nRF Connect SDK v2.9.0-7787b2649840 ***
*** Using Zephyr OS v3.7.99-1f8f3dc29142 ***
IPC-service unny/nrf5340/cpunet demo started
Δpkt: 50 (100 B/pkt) | throughput: 40000 bit/s
Δpkt: 50 (100 B/pkt) | throughput: 40000 bit/s
[00:00:04.614,440] <inf> sync_rtc: Updated timestamp to synchronized RTC by 75434 ticks (2302062us)
Δpkt: 50 (100 B/pkt) | throughput: 40000 bit/s
Δpkt: 49 (100 B/pkt) | throughput: 39200 bit/s
Δpkt: 50 (100 B/pkt) | throughput: 40000 bit/s
```
This is weird… Why did the delay time increase work? It seems like a sync problem with RX TX or a problem with the processing.
Ok, just to be sure that my IPC is not working properly I decided to test the radio using the [radio test.](https://github.com/nrfconnect/sdk-nrf/tree/main/samples/peripheral/radio_test)
I changed the [subsys/shell/shell_ipc.c][ https://github.com/nrfconnect/sdk-nrf/blob/main/subsys/shell/shell_ipc.c] changing all LOG_DBG to LOG_INF because I want to see the logs. After that I flashed the firmware in my MCU and used the command:
```sh
$> screen /dev/ttyACM0
```
After using the command, the LOG that shows to me in RTT is:
```
*** Booting nRF Connect SDK v2.9.0-7787b2649840 ***
*** Using Zephyr OS v3.7.99-1f8f3dc29142 ***
[00:00:02.047,790] <inf> remote_shell: Wait for DTR
[00:00:02.051,849] <inf> usb_cdc_acm: Device suspended
[00:00:02.169,494] <inf> usb_cdc_acm: Device resumed
[00:00:02.169,494] <inf> usb_cdc_acm: from suspend
[00:00:02.413,940] <inf> usb_cdc_acm: Device configured
[00:00:07.051,177] <inf> remote_shell: DTR set
[00:00:08.068,450] <inf> remote_shell: Baudrate detected: 9600
```
But nothing appears on screen I have just a blank terminal, but when I decided to type some characters in this blank terminal the LOG in the RTT changes:
```
*** Booting nRF Connect SDK v2.9.0-7787b2649840 ***
*** Using Zephyr OS v3.7.99-1f8f3dc29142 ***
[00:00:02.047,790] <inf> remote_shell: Wait for DTR
[00:00:02.051,849] <inf> usb_cdc_acm: Device suspended
[00:00:02.169,494] <inf> usb_cdc_acm: Device resumed
[00:00:02.169,494] <inf> usb_cdc_acm: from suspend
[00:00:02.413,940] <inf> usb_cdc_acm: Device configured
[00:00:07.051,177] <inf> remote_shell: DTR set
[00:00:08.068,450] <inf> remote_shell: Baudrate detected: 9600
[00:01:32.637,664] <inf> remote_shell: Sent 1 bytes
[00:01:32.756,530] <inf> remote_shell: Sent 1 bytes
[00:01:32.848,968] <inf> remote_shell: Sent 1 bytes
[00:01:32.996,948] <inf> remote_shell: Sent 1 bytes
[00:01:33.033,782] <inf> remote_shell: Sent 1 bytes
[00:01:33.126,281] <inf> remote_shell: Sent 1 bytes
[00:01:33.219,909] <inf> remote_shell: Sent 2 bytes
```
That is, the microcontroller receives input from my keyboard, but unlike the openthread cli that we have a working CLI here, nothing appears to me. It seems that there is a problem with the communication between CPUAPP and CPUNET that is not working and showing me the cli.
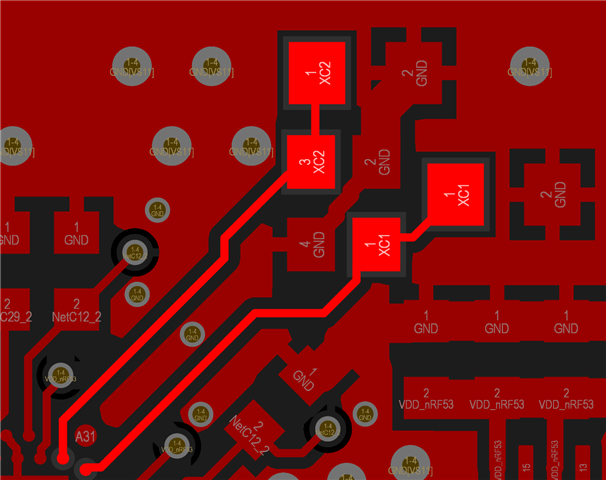
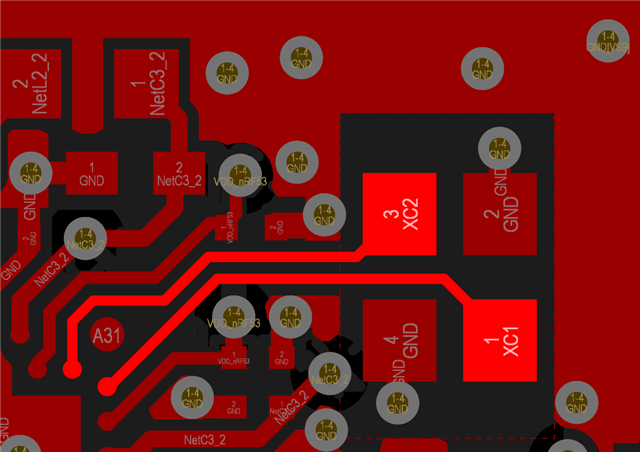
I won't put the .dts and kconfigs here in text because it will make the text bigger, but I will attach all the .dts, prj.conf and my PCB devicetree.
My questions are:
-> About the ipc example.
Why doesn’t the application core showing a similar log on the website when I build the default?
Why doesn't it show the log when using RPMSG?
-> About the radio test example.
Why can't I access the ipc shell?
How can I access the ipc shell?
Why isn't my radio working?
How can I find out what's going on with my radio?
Any help in finding out what's going on would be appreciated.
Thanks.