nRF Connect SDK Toolchain v2.4.2, Windows 10
Hi,
We're running low on RAM on the nRF5340 application core, and I'm looking into ways to recover RAM both from our application and from the Zephyr configuration.
My team suspects that the rpmsg_nrf53_sram partition is not fully used within our BLE application; however, I currently have no way to check or verify this apart from stress-testing the application. I spent some time diving into the RPMsg implementation code and came to the understanding that the implementation of writing to the shared memory is so far abstracted that it isn't feasible to monitor the actual memory addresses written to in order to determine how much of the shared SRAM is being used. I've been spot-checking the memory addresses in Ozone, but that's not a scalable solution.
Is there a way to programmatically check how much of the rpmsg_nrf53_sram is used during the application, ideally in a similar manner to Thread Analyzer?
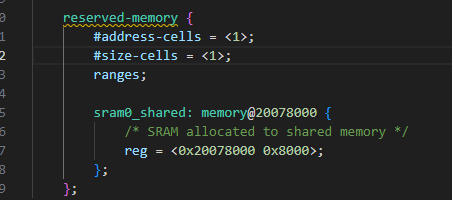
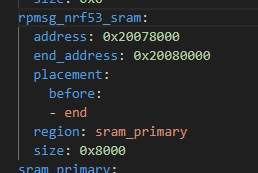
edit: I'm fairly confident I have the shared SRAM start/size changed everywhere in our code that matters, but now I see IPC failures. My first assumption is that there's something (hardcoded?) expecting 0x20070000 to be the start of the shared SRAM, so it fails to set up IPC. Is there a Kconfig or similar I'm missing to ensure both cores + the SDK code know where to go? I do have the Kconfig for shared SRAM size set.