RTT Viewer doesn't show any debug messages from nrf52833.

We use nrf52833 chip but I don't know which SDK and version.

but I used "s113_nrf52_7.2.0_softdevice.hex" in our project having started on 2021.01.27.

So, It's old project starting before.

The problem is as followings:

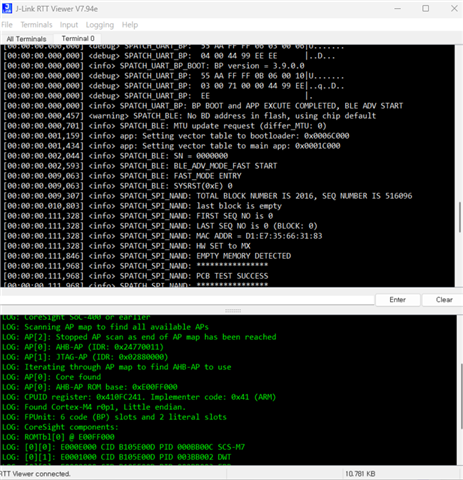
Our target device is connected with RTT Viewer.

However, RTT Viewer dosen't show any log messages from our target device.

Our project's current configuration for RTT logging are as followings on "sdk_config.h" header file.

1. define belows. 

#define NRF_LOG_ENABLED 1
#define NRF_LOG_BACKEND_RTT_ENABLED 1

2. call on main() function.

NRF_LOG_DEFAULT_BACKENDS_INIT();
Do we have to do more anything for logging on RTT Viewer?
In addition, I attach our "sdk_config.h" file.
Please check it and advice me.
  • I found missing definition, 

    NRF_LOG_USES_RTT used in SEGGER_RTT_Syscalls_GCC.c file.

    So I added the definition on our project source.

    However, it dosen't work with RTT Viewer via swd.

    First of all, we can connect  our target through J-link OB debugger RTT viewer.

    The following log says:

    LOG: J-Link RTT Viewer V7.94e: Logging started.
    LOG: Terminal 0 added.
    LOG: Connecting to J-Link via USB...
    LOG: Device "NRF52833_XXAA" selected.
    LOG: InitTarget() start
    LOG: CTRL-AP indicates that the device is secured.
    For debugger connection the device needs to be unsecured.
    Note: Unsecuring will trigger a mass erase of the internal flash.
    
    
    LOG: Executing default behavior previously saved in the registry.
    LOG: Device will be unsecured now.
    LOG: InitTarget() end - Took 230ms
    LOG: Found SW-DP with ID 0x2BA01477
    LOG: DPIDR: 0x2BA01477
    LOG: CoreSight SoC-400 or earlier
    LOG: Scanning AP map to find all available APs
    LOG: AP[2]: Stopped AP scan as end of AP map has been reached
    LOG: AP[0]: AHB-AP (IDR: 0x24770011)
    LOG: AP[1]: JTAG-AP (IDR: 0x02880000)
    LOG: Iterating through AP map to find AHB-AP to use
    LOG: AP[0]: Core found
    LOG: AP[0]: AHB-AP ROM base: 0xE00FF000
    LOG: CPUID register: 0x410FC241. Implementer code: 0x41 (ARM)
    LOG: Found Cortex-M4 r0p1, Little endian.
    LOG: FPUnit: 6 code (BP) slots and 2 literal slots
    LOG: CoreSight components:
    LOG: ROMTbl[0] @ E00FF000
    LOG: [0][0]: E000E000 CID B105E00D PID 000BB00C SCS-M7
    LOG: [0][1]: E0001000 CID B105E00D PID 003BB002 DWT
    LOG: [0][2]: E0002000 CID B105E00D PID 002BB003 FPB
    LOG: [0][3]: E0000000 CID B105E00D PID 003BB001 ITM
    LOG: [0][4]: E0040000 CID B105900D PID 000BB9A1 TPIU
    LOG: [0][5]: E0041000 CID B105900D PID 000BB925 ETM
    LOG: RTT Viewer connected

    Then, we couldn't see the device logs from our target using RTT viewer.

    I guess the conditions goes good a little, however we can't see the logs.

    Please advice me.

    Thanks,

    Jaehong Park

  • I tested ble_app_uart, example on nRF53833 DK when I use on SES and RTT Viewer.

    The example works well on nRF52833 DK as following SES and RTT Viewer's screenshots.

    1. SES

    2. RTT Viewer

    Then on RTT viewer, it works when I pressed reset button on DK board after connecting nRF SoC using J-link OB. I guess it needs to restart the appllication after connecting to nRF SoC on DK board.

    First of all, our target only use 4 pins in swdio, swdclk, Vdd, Gnd.

    So, do we have to connect reset pin on our custom target with J-link OB on DK?

    and then I mean give the reset signal to our custom target via reset pin after connection with j-link OB.

    Please guide us how.

    Thanks,

    Jaehong Park

  • Hi,

    I found that there didn't happened on RTT device logs on our target.

    When we just download our fw to our custom target via jflash tool, and after reading back on target's memory, it is normal as following screenshot on jflash tool:

    Then the next is when reading back on target's memory ,right after attaching by j-link on RTT Viewer.

    it is abnormal that our target flash memory was initialize and written in 0xFF ,like erasing memory.

    the followings is abnormal screenshot.

    I guess I saw the following logs on RTT Viewer.

    LOG: CTRL-AP indicates that the device is secured.
    For debugger connection the device needs to be unsecured.
    Note: Unsecuring will trigger a mass erase of the internal flash.

    It was erased because of the above message.

    Please check this and inform us why it happened.

    Thanks,

    Jaehong Park

  • Hi,

    I found a little solution of this issue.

    The next sequence is a small solution of this.

    1. Connect target via j-link OB on RTT viewer.

    2. Open J-Link.exe CLI program under C:\Program Files\SEGGER\JLink_V812b

    3. Connect target via j-link OB on CLI app.

    4. input command as "r", "s", "g", "r", "g", etc on CLI app like the attached command.

    5. Then we can see the logs from RTT viewer.

    The attached command on CLI app.

    C:\Program Files\SEGGER\JLink_V812b>JLink.exe
    SEGGER J-Link Commander V8.12b (Compiled Jan 15 2025 12:16:22)
    DLL version V8.12b, compiled Jan 15 2025 12:15:23
    
    Connecting to J-Link via USB...O.K.
    Firmware: J-Link OB-SAM3U128-V2-NordicSemi compiled Jul 24 2017 17:30:12
    Hardware version: V1.00
    J-Link uptime (since boot): N/A (Not supported by this model)
    S/N: 685079944
    License(s): RDI, FlashBP, FlashDL, JFlash, GDB
    VTref=3.300V
    
    
    Type "connect" to establish a target connection, '?' for help
    J-Link>connect
    Please specify device / core. <Default>: NRF52833_XXAA
    Type '?' for selection dialog
    Device>
    Please specify target interface:
      J) JTAG (Default)
      S) SWD
      T) cJTAG
    TIF>S
    Specify target interface speed [kHz]. <Default>: 4000 kHz
    Speed>
    Device "NRF52833_XXAA" selected.
    
    
    Connecting to target via SWD
    InitTarget() start
    InitTarget() end - Took 3.86ms
    Found SW-DP with ID 0x2BA01477
    DPv0 detected
    CoreSight SoC-400 or earlier
    Scanning AP map to find all available APs
    AP[2]: Stopped AP scan as end of AP map has been reached
    AP[0]: AHB-AP (IDR: 0x24770011, ADDR: 0x00000000)
    AP[1]: JTAG-AP (IDR: 0x02880000, ADDR: 0x01000000)
    Iterating through AP map to find AHB-AP to use
    AP[0]: Core found
    AP[0]: AHB-AP ROM base: 0xE00FF000
    CPUID register: 0x410FC241. Implementer code: 0x41 (ARM)
    Found Cortex-M4 r0p1, Little endian.
    FPUnit: 6 code (BP) slots and 2 literal slots
    CoreSight components:
    ROMTbl[0] @ E00FF000
    [0][0]: E000E000 CID B105E00D PID 000BB00C SCS-M7
    [0][1]: E0001000 CID B105E00D PID 003BB002 DWT
    [0][2]: E0002000 CID B105E00D PID 002BB003 FPB
    [0][3]: E0000000 CID B105E00D PID 003BB001 ITM
    [0][4]: E0040000 CID B105900D PID 000BB9A1 TPIU
    [0][5]: E0041000 CID B105900D PID 000BB925 ETM
    Memory zones:
      Zone: "Default" Description: Default access mode
    Cortex-M4 identified.
    J-Link>s
    
    ****** Error: CPU is not halted
    J-Link>r
    Reset delay: 0 ms
    Reset type: NORMAL (https://wiki.segger.com/J-Link_Reset_Strategies)
    Reset: Halt core after reset via DEMCR.VC_CORERESET.
    Reset: Reset device via AIRCR.SYSRESETREQ.
    J-Link>s
    00000A80:   06 4B              LDR       R3, [PC, #+0x18]
    J-Link>g
    Memory map 'after startup completion point' is active
    J-Link>s
    
    ****** Error: CPU is not halted
    J-Link>r
    Reset delay: 0 ms
    Memory map 'before startup completion point' is active
    Reset type: NORMAL (https://wiki.segger.com/J-Link_Reset_Strategies)
    Reset: Halt core after reset via DEMCR.VC_CORERESET.
    Reset: Reset device via AIRCR.SYSRESETREQ.
    J-Link>g
    Memory map 'after startup completion point' is active
    J-Link>

    after input command on CLI app, RTT viewer give up device logs as following screenshot:

    Anyway, we started a little more for fixing this issue.

    Then, I guess RTT viewer grabbed and held the booting start of device.

    Please advice us how to fix it.

    Thanks,

    Jaehong

  • Hi,

    Our custom linker file has a different RAM address and size between DFU bootloader and main application.

    After setting RAM address and size of main app. on RTT Viewer, we checked the device logs.

    Thanks,

    Jaehong Park

Related