When the clock source is LFRC then the device goes into high power state which is ~800uA

I have my application running (NCS 2.6.4) on the bench with clock source set as internal RC and with the configurations such as -

CONFIG_CLOCK_CONTROL_NRF_K32SRC_RC=y
CONFIG_CLOCK_CONTROL_NRF_K32SRC_RC_CALIBRATION=y
CONFIG_CLOCK_CONTROL_NRF_CALIBRATION_PERIOD=5000
CONFIG_CLOCK_CONTROL_NRF_CALIBRATION_LF_ALWAYS_ON=y
CONFIG_CLOCK_CONTROL_NRF_CALIBRATION_MAX_SKIP=10

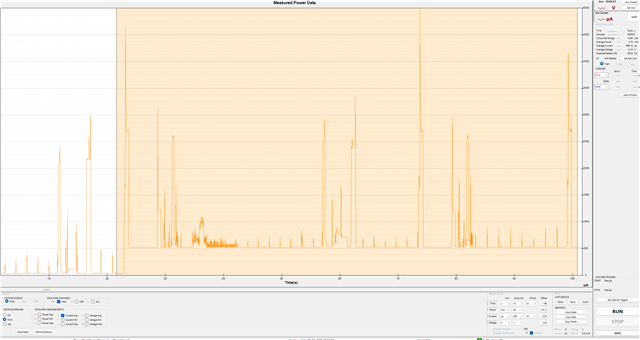
But when I do multiple resets using nrfjprog --reset then the device goes into high power state which have the average current as ~800uA but the application runs normally and there is no issue in functionality.
When I switch the clock configuration to XTAL then the issue goes away which signifies there is some issue with the clock source and I am able to replicate the same state on the board with blinky example with the above clock configurations.

Any workaround which can solve this issue apart from changing the configuration to XTAL.

Parents
  • Hi,

    Is there a chance that the device is still in debug mode when you test this? In debug mode the device will not enter IDLE sleep but will not emulate it. Debug mode is activated when the debugger is connected, and disconnecting the debugger is not enough to exit debug mode. Only a power on reset will 100% exit debug mode, although I would have expected pin reset to have similar result.

    regards
    Jared 

Reply
  • Hi,

    Is there a chance that the device is still in debug mode when you test this? In debug mode the device will not enter IDLE sleep but will not emulate it. Debug mode is activated when the debugger is connected, and disconnecting the debugger is not enough to exit debug mode. Only a power on reset will 100% exit debug mode, although I would have expected pin reset to have similar result.

    regards
    Jared 

Children
  •  Yes the debugger was connected but the behaviour is very weird here as the device stays in high power state even in pin resets state.
    For this to debug I have added to note down ramp up time of HFXO and this value was coming as 1uS for this scenario. And when I DFU or flash application with XTAL configured then the issue goes away.

  • Hi,

    It could possibly be some other reason,

    Gaurav said:
    For this to debug I have added to note down ramp up time of HFXO and this value was coming as 1uS for this scenario.

    Can you try to explain this again? I'm not sure I understand you correctly here,

    Have you been able to reproduce this on a development kit and when you measure the current consumption. Can you explain where and how you measure? If you can show by sharing schematic and specify what node on the schematic you are measuring from, it would be great.

    For example, maybe some external device is put into a non expected current consuming state after you reset the nRF52840 but you have to power cycle the whole board to recover it. 

    regards

    Jared 

  • We have switched our clock reference to internal RC as the XTAL config was showing lot of issues on production and on field.

    We have tried to replicate this issue on the board that we have made custom and have been shipping this hardware from the last 2 years and never faced this issue and since we switched to internal RC and with the config shared above we are able to replicate this on bench.

    We have even tried this on sample/bluetooth/blinky and with the same clock config and that was also showing the same power drain of ~900uA.
    And to fix this issue if we do Power on Reset or changing the config to XTAL, it gets fixed.
    So certainly something is wrong with the clock configs where the internal RC on startup is not able to calibrate with the HFXO.
    This is how the power profile looks when the high power state gets triggered-


Related