Compile nrf5340 project under vscode, terminal window give flash occupied statistics, but there are three statistic block about used flash region, which report is valid(what I need) ?

use "nrf5340 cpuapp" to compile project,  flash statistics as follows, see blue color

[3/11] Linking C executable zephyr\zephyr_pre0.elf

[6/11] Linking C executable zephyr\zephyr_pre1.elf

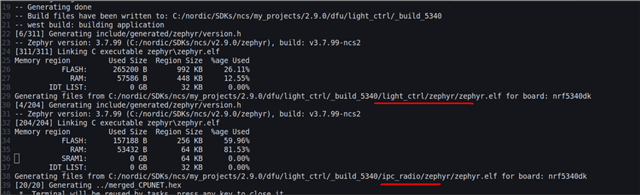
[11/11] Linking C executable zephyr\zephyr.elf
Memory region Used Size Region Size %age Used
FLASH: 44160 B 48 KB 89.84%                                  //flash statistics go out first time 
RAM: 22848 B 448 KB 4.98%
IDT_LIST: 0 GB 2 KB 0.00%
[3/26] Linking C executable zephyr\zephyr_pre0.elf

[6/26] Linking C executable zephyr\zephyr_pre1.elf

[3/13] Linking C executable zephyr\zephyr_pre0.elf

[6/13] Linking C executable zephyr\zephyr_pre1.elf

[11/13] Linking C executable zephyr\zephyr.elf
Memory region Used Size Region Size %age Used
FLASH: 158008 B 256 KB 60.28%                             //flash statistics go out second time 
RAM: 39808 B 64 KB 60.74%
SRAM1: 0 GB 64 KB 0.00%
IDT_LIST: 0 GB 2 KB 0.00%
[12/24] Linking C executable zephyr\zephyr.elf
Memory region Used Size Region Size %age Used

FLASH: 255660 B 491008 B 52.07%                          //flash statistics go out third time 

RAM: 51784 B 448 KB 11.29%

IDT_LIST: 0 GB 2 KB 0.00%

[15/24] Generating ../../zephyr/app_update.bin
image.py: sign the payload

[17/24] Generating ../../zephyr/app_signed.hex
image.py: sign the payload

[18/24] Generating ../../zephyr/app_test_update.hex
image.py: sign the payload

[22/22] Generating zephyr/merged_domains.hex

So which is final correct one ? which one should I follow ?

Parents
  • Hello,

    Did you strip out parts of the log? Or are you using an older version of NCS? 

    At least when testing in v2.9.0, you have some hints to what image the numbers are coming from:

    But the short answer is that your three flash statistics belong to their own sub-applications, or child images. One is for the application itself, the other is for the network image (the BLE stack and SoftDevice Controller), and the last one is the Bootloader (MCUBOOT). 

    If you didn't cut anything out of the build log, and you want more information, you can apply this patch to the file: NCS\zephyr\CMakeLists.txt:

    https://github.com/zephyrproject-rtos/zephyr/pull/66217/commits/0fbd45676f85c8260c6885f1f3a19e3be6abc131

    And it should print something similar to the one in the screenshot. This is from a different build, for an nRF5340, but without a bootloader, but you can see that the line directly below the flash % numbers describes what image the numbers belongs to. So this uses 26.11% of the flash available for the application core, and 59.96% of the flash avalable on the network core.

    Best regards,

    Edvin

Reply
  • Hello,

    Did you strip out parts of the log? Or are you using an older version of NCS? 

    At least when testing in v2.9.0, you have some hints to what image the numbers are coming from:

    But the short answer is that your three flash statistics belong to their own sub-applications, or child images. One is for the application itself, the other is for the network image (the BLE stack and SoftDevice Controller), and the last one is the Bootloader (MCUBOOT). 

    If you didn't cut anything out of the build log, and you want more information, you can apply this patch to the file: NCS\zephyr\CMakeLists.txt:

    https://github.com/zephyrproject-rtos/zephyr/pull/66217/commits/0fbd45676f85c8260c6885f1f3a19e3be6abc131

    And it should print something similar to the one in the screenshot. This is from a different build, for an nRF5340, but without a bootloader, but you can see that the line directly below the flash % numbers describes what image the numbers belongs to. So this uses 26.11% of the flash available for the application core, and 59.96% of the flash avalable on the network core.

    Best regards,

    Edvin

Children
No Data
Related