Why does the phase value collected by a single antenna at different times fluctuate so significantly in Bluetooth AOA (Angle of Arrival) measurements?

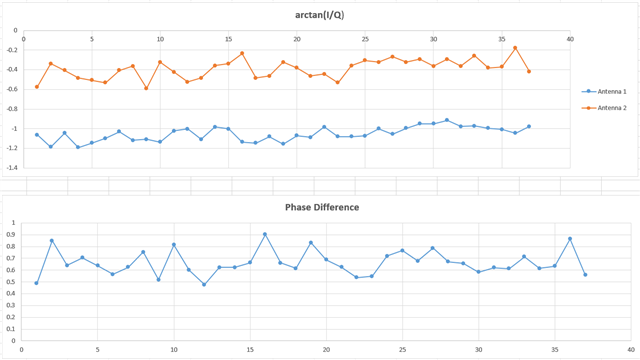
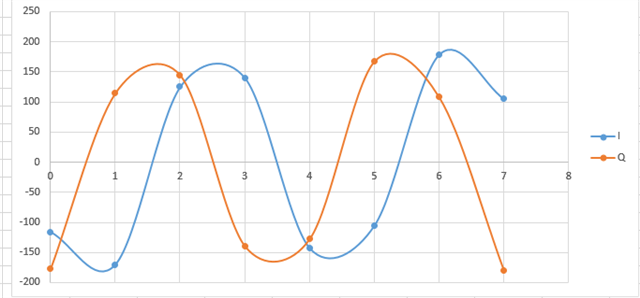
When using Bluetooth AOA, I configured only two antennas to collect IQ data. Below are the curves formed by the 37 IQ data points collected from the two antennas during the sampling phase, including the phase (arctan(Q/I)) and the phase difference between the two antennas. Based on my understanding, the phase collected by each antenna should be consistent, but the data here shows surprisingly large fluctuations. Is this normal?

Thank you very much for your reply!

Parents Reply Children
  • Thank you for your reply! Below is the curve corresponding to the IQ values during the reference phase, which very much fits the theoretical situation where the phase difference between I and Q is 90 degrees. Since there was no antenna switching during the reference phase and the sampling period is 1us, with the CTE signal frequency being 250KHz, it should be possible to collect 8 data points, corresponding to two cycles of the CTE signal. However, during the sampling phase, since two antennas were used and the sampling time slot and antenna switching time slot are 1us, and given that the signal frequency is 250KHz (i.e., the signal period is 4us), I believe that the phase difference between multiple data points collected by the same antenna should just be an integer multiple of 2π, and the numerical value should remain unchanged. But in reality, after converting the collected data into phases, there is a large fluctuation, and I'm not sure if I misunderstood something?

  • Sorry to bother you. You mentioned calculating expected values based on a reference cycle, but I’m not entirely clear on what exactly this means or how the calculation is performed. Could you please clarify?

  • So all frequencies used in Direction Finding are "typical" and your calculation will only be true if they are all the typical value. If any of them are slightly off then it's not true.

    You need to use the data from the reference period to calculate the actual frequency of the system and also calculate a reference point in time where you know the phase (may need to do some filtering to make sure the anchor point is solid). Then you can use this to calculate the theoretical phase for all sampling points in the normal period. Then you can calculate the phase shift for each of these points.

  • I understand. To confirm, you're suggesting that even if the theoretical frequency is 250KHz, the actual signal frequency may deviate slightly (higher or lower), causing a shift in the cycle. This results in the phase of the data sampled from the same antenna during the sampling phase not being a perfect 2π. By first using reference cycle data to fit the actual frequency of the current signal, we can establish a known phase-correlated time point. Then, all subsequent phases can be calculated based on the sampling timestamps.

    Apologies, I have one additional question: Is this known phase time point derived from the fitted signal curve generated using the data collected during the reference phase?

  • Yes, the phase at the reference point in time should be extracted from the data in the reference period, you may need to filter it somewhat to make sure that noise in a single sample doesn't impact the point too much as this would impact all you data later on.

    Note: the issue is not only for the 250/500KHz, there will also be small errors for the RF base frequency so you won't have exaclty 2.410.000.000 Hz, the accuracy of the crystal is some ppms and this will change the frequency. This will be different part to part and vary over temperature and voltage. This is why you use the reference period to remove all these issues so the solution is self correcting.

Related