nRF Cloud Log backend doesn't filter unwanted messages generated as a side effect of sending other log messages

Hi!

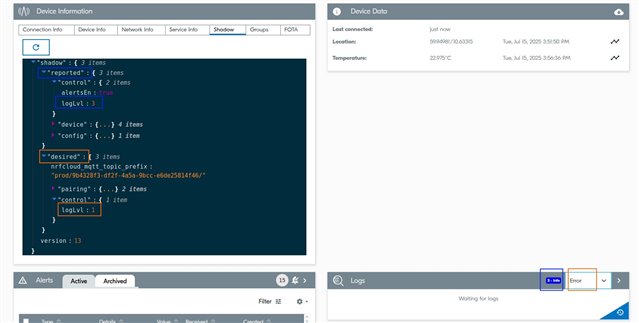
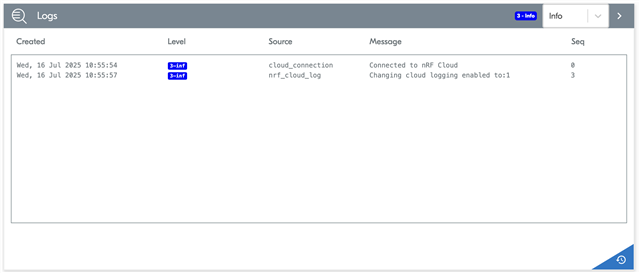
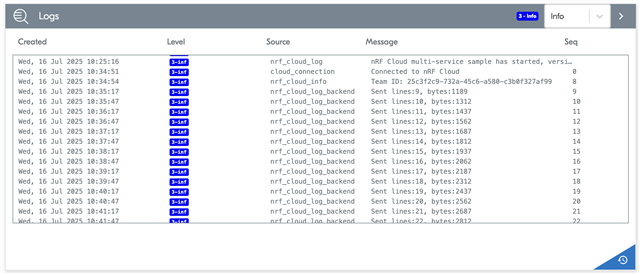
We use nRF Cloud Log backend in our project. And during my research I found that it actually doesn't filter (despite the filtering code is there) messages generated by underlying libs when application log messages are sent to the cloud. This creates an endless stream of messages being sent to the cloud, even if the application is no longer logging messages.

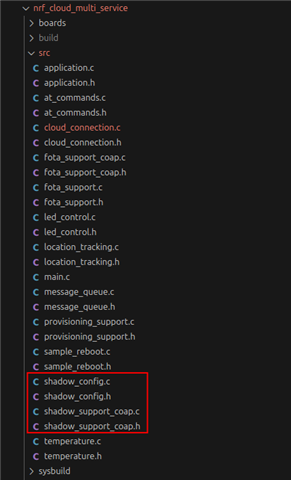
It seems, I see a confirmation for this issue in the code. Here logger_init() is called, it sets up filtering by calling log_filter_set(..., 0) for every source that needs to be filtered out, and then log_backend_enable() is called which actually resets filtering by calling log_filter_set(..., level) for all sources registered in the logger.

My SDK version is 2.9.0. But I see that this code hasn't been changed since that version.

My configuration contains:
CONFIG_LOG_RUNTIME_FILTERING=y
CONFIG_NRF_CLOUD_LOG_BACKEND=y
# This option leads to sending endless messages like this "Sent lines:516, bytes:70952"
CONFIG_NRF_CLOUD_LOG_LOG_LEVEL_INF=y


This issue is currently not critical for our project.

Thank you!

Parents
  • Hello Alexey,

    I sent you an email early this week, let me know if this is still an issue.

    Regards,

    Pascal.

  • Hi Pascal,
    Thanks for your email. We (Ruslan) has found it ;)
    - The question is not critical for our current project but we would like to clarify it anyway.
    - It is not related to the cloud logging configuration/filtering/etc. It is related to the source code.
    - We use the SDK code (including the nrf_cloud_log_backend.c file) in our project, so we looked at that source code and have this question.
    - It is formulated in the original post in this thread. Pls have a look at it.
    - Just to repeat it briefly:
      -- There is some code to prevent an endless sending of log messages.
      -- It uses filtering of logs from some sources. The filtered_modules array defines these sources.
      -- But there seems an issue in the code - in the logs_backend_enable() function - logger_init() sets the mentioned filtering, but right after that log_backend_enable() resets it. So, the needed filtering does not work.
    - Can you please review that source code and either confirm there is the issue, or explain how it works if the code is correct.
    - We will try to reproduce the issue on practice, but will need to find time for that.
    Thank you!
    -Alexey

  • Hello Alexey,

    This is a feature that leverage Zephyr's Logging subsystem. nRF Cloud received the logging and displays it in the Logs Card. This is also available for binary logging for a smaller memory footprint.

    The Logs card's UI allows you to select which is the desired level of logging you would like to visualize in the cards but this is not something that is being filtered in the front end neither in the back end of nRF Cloud. When you select the desired log level, this will be changed in AWS shadow and wait for the device to connect to nRF Cloud to catch this new desired value (which is considered a delta) and execute in the application the desired configuration changes. Once this is done, the device reports back the current state, this is then visualized on the left side of the options to select in the Logs card. If you pass your mouse on top of it, it will describe what I'm mentioning.


    As you can see in the picture above, I remarked on blue the "reported" by the device and in orange the "desired".

    If you look at the Multi Service sample, you will notice there are a few files that controls the Shadow control on the device. There are some specific for CoAP and MQTT. If your project lacks of shadow support and has nRF Cloud logging enabled, the device will send the log to nRF Cloud but you will not be able to control the device.


    My recommendation would be to compile the Multi Service sample with the overlay_nrfcloud_logging.conf and see how this changes.

    So you are aware, this feature is not responsive. It takes ~120 seconds to be able to visualize the change on the reported sections I mentioned before.

    Pascal.

Reply
  • Hello Alexey,

    This is a feature that leverage Zephyr's Logging subsystem. nRF Cloud received the logging and displays it in the Logs Card. This is also available for binary logging for a smaller memory footprint.

    The Logs card's UI allows you to select which is the desired level of logging you would like to visualize in the cards but this is not something that is being filtered in the front end neither in the back end of nRF Cloud. When you select the desired log level, this will be changed in AWS shadow and wait for the device to connect to nRF Cloud to catch this new desired value (which is considered a delta) and execute in the application the desired configuration changes. Once this is done, the device reports back the current state, this is then visualized on the left side of the options to select in the Logs card. If you pass your mouse on top of it, it will describe what I'm mentioning.


    As you can see in the picture above, I remarked on blue the "reported" by the device and in orange the "desired".

    If you look at the Multi Service sample, you will notice there are a few files that controls the Shadow control on the device. There are some specific for CoAP and MQTT. If your project lacks of shadow support and has nRF Cloud logging enabled, the device will send the log to nRF Cloud but you will not be able to control the device.


    My recommendation would be to compile the Multi Service sample with the overlay_nrfcloud_logging.conf and see how this changes.

    So you are aware, this feature is not responsive. It takes ~120 seconds to be able to visualize the change on the reported sections I mentioned before.

    Pascal.

Children
No Data
Related