Hi,
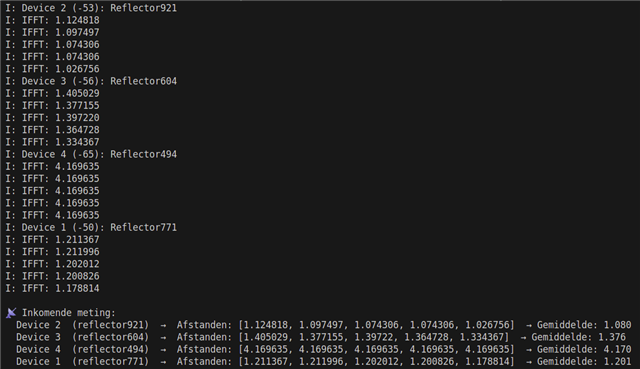
my name is Nick De Leenheer, and i am finishing my thesis on indoor localisation with CHANNEL SOUNDING. i currently got these outputs in my venv using SERIAL:
so i use the ranging data from 4 different devices, and then i use this multilateration algorithm:
def multilateration_2d(anchors: list, ranges: list, z_true: float = 0, dynamic: bool = False, anchors_pos: dict = None) -> np.ndarray:
    ranges_ = {}
    for a, r in zip(anchors, ranges):
        if a not in ranges_:
            ranges_[a] = [r]
        else:
            ranges_[a].append(r)
    anchors = list(ranges_.keys())
    ranges = [np.median(r) for r in ranges_.values()]

    if len(ranges) < 3:
        return None
    if dynamic:
        anchors = anchors[-3:]
        ranges = ranges[-3:]
    A = np.zeros((len(anchors), 3))
    b = np.zeros(len(anchors))
    for i, (anchor, range_val) in enumerate(zip(anchors, ranges)):
        anchor_pos = anchors_pos[anchor]
        range_sq = range_val**2 - (anchor_pos[2] - z_true)**2
        A[i, :] = 1, -2 * anchor_pos[0], -2 * anchor_pos[1]
        b[i] = range_sq - anchor_pos[0]**2 - anchor_pos[1]**2
    if np.linalg.cond(A.T @ A) < 1 / np.finfo(A.dtype).eps:
        return (np.linalg.inv(A.T @ A) @ A.T @ b)[1:]
    return None
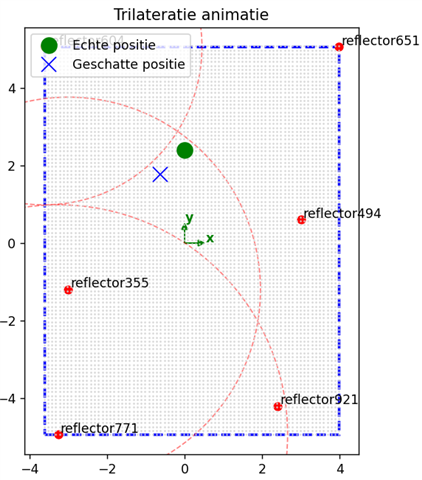
afterwards, i want to plot 4 ranging circles from the 4 reflector (beacons) to estimate the location of the tag...
But this plt.show() in my code doesnt work iteratively... so i am wondering what would work best to update and show my plot. Captured data i was able to plot in an animation with animate from matplotlib. But now i don't know what would work on my LINUX computer.
(here is my total code)
import serial
import re
import numpy as np
import matplotlib.pyplot as plt


# --- Parameters ---
MAX_DEVICES = 4
RANGING_ROUNDS = 5

# Reflectorposities
reflector_positions_ugent = {
    "reflector921": (2.4, -4.2, 0.0),
    "reflector494": (3.0, 0.6, 0.0),
    "reflector355": (-3.0, -1.2, 0.0),
    "reflector651": (3.98, 5.05, 0.0),
    "reflector604": (-3.62, 5.05, 0.0),
    "reflector771": (-3.26, -4.93, 0.0),
}

# Reflectorposities
reflector_positions = {
    "reflector771": (0.4, 0.0, 0.0),
    "reflector921": (0.8, 0.0, 0.0),
    "reflector494": (1.1, 0.0, 0.0),
    "reflector604": (1.5, 0.0, 0.0),
}

min_x = min(pos[0] for pos in reflector_positions.values()) - 1
max_x = max(pos[0] for pos in reflector_positions.values()) + 1
min_y = min(pos[1] for pos in reflector_positions.values()) - 1
max_y = max(pos[1] for pos in reflector_positions.values()) + 1

dx = 0.1
x = np.arange(min_x, max_x + dx, dx)
y = np.arange(min_y, max_y + dx, dx)
X, Y = np.meshgrid(x, y)
grid_points = np.vstack([X.ravel(), Y.ravel()]).T


def error(point, beacons, measured):
    return sum((np.linalg.norm(np.array(point) - np.array(beacons[b])) - measured[b])**2 for b in measured)

def trilaterate(beacons, measured):
    if len(measured) < 3:
        return None
    best = min(grid_points, key=lambda p: error(p, beacons, measured))
    best = np.asarray(best).astype(float).tolist()  # <-- expliciet converteren
    return tuple(best)

def multilateration_2d(anchors: list, ranges: list, z_true: float = 0, dynamic: bool = False, anchors_pos: dict = None) -> np.ndarray:
    ranges_ = {}
    for a, r in zip(anchors, ranges):
        if a not in ranges_:
            ranges_[a] = [r]
        else:
            ranges_[a].append(r)
    anchors = list(ranges_.keys())
    ranges = [np.median(r) for r in ranges_.values()]

    if len(ranges) < 3:
        return None
    if dynamic:
        anchors = anchors[-3:]
        ranges = ranges[-3:]
    A = np.zeros((len(anchors), 3))
    b = np.zeros(len(anchors))
    for i, (anchor, range_val) in enumerate(zip(anchors, ranges)):
        anchor_pos = anchors_pos[anchor]
        range_sq = range_val**2 - (anchor_pos[2] - z_true)**2
        A[i, :] = 1, -2 * anchor_pos[0], -2 * anchor_pos[1]
        b[i] = range_sq - anchor_pos[0]**2 - anchor_pos[1]**2
    if np.linalg.cond(A.T @ A) < 1 / np.finfo(A.dtype).eps:
        return (np.linalg.inv(A.T @ A) @ A.T @ b)[1:]
    return None

# --- Serial ---
ser1 = serial.Serial('/dev/ttyACM1', 115200, timeout=1)
ser3 = serial.Serial('/dev/ttyACM3', 115200, timeout=1)

device_data = {}
current_device = None
current_reflector = None

# --- Plot ---
fig, ax = plt.subplots(figsize=(8, 6))
ax.set_xlim(min_x - 0.5, max_x + 0.5)
ax.set_ylim(min_y - 0.5, max_y + 0.5)
ax.set_aspect('equal')
ax.set_title("Live Trilateratie")

ax.arrow(0, 0, 0.5, 0, head_width=0.05, head_length=0.05, fc='green', ec='green')
ax.arrow(0, 0, 0, 0.5, head_width=0.05, head_length=0.05, fc='green', ec='green')
ax.text(0.55, 0.02, 'x', color='green', fontsize=10, fontweight='bold')
ax.text(0.02, 0.55, 'y', color='green', fontsize=10, fontweight='bold')

rect = plt.Rectangle((min_x, min_y), max_x - min_x, max_y - min_y,
                     linewidth=2, edgecolor='blue', facecolor='none', linestyle='--')
ax.add_patch(rect)

# Beacons tekenen
for name, (bx, by, _) in reflector_positions.items():
    ax.plot(bx, by, 'ro')
    ax.text(bx + 0.05, by + 0.05, name, fontsize=8)


position_dot, = ax.plot([], [], 'bx', markersize=12, label='Geschatte positie')
range_circles = []


################################################ MAIN LOOP ##########################################################################
while True:
    try:
        # KIES 1 VAN DE 2 (soms ACM1 -> ser1, soms ACM3->ser3):
        line = ser1.readline().decode("utf-8").strip()

        # Sla alles over wat niet relevant is
        if not line or "NULL" in line or line.startswith("W:") or "Disconnected" in line:
            continue

        print(line)

        # Device-regel
        if line.startswith("I: Device") and "Reflector" in line:
            match = re.search(r"Device (\d+).*Reflector(\d+)", line)
            if match:
                current_device = int(match.group(1))
                current_reflector = "reflector" + match.group(2)
                if current_device not in device_data:
                    device_data[current_device] = {"name": current_reflector, "ifft": []}

        # IFFT-regel
        elif line.startswith("I: IFFT:") and current_device in device_data:
            try:
                val = float(line.split("IFFT:")[1].strip())
                data = device_data[current_device]["ifft"]
                if len(data) < RANGING_ROUNDS:
                    data.append(val)
            except ValueError:
                continue

        # Check of we een volledige localisatie hebben
        complete_devices = {d: info for d, info in device_data.items() if len(info["ifft"]) == RANGING_ROUNDS}
        if len(complete_devices) == MAX_DEVICES:
            # Gemiddelden berekenen
            measurements = {}
            print("\n📡 Inkomende meting:")
            for dev_id, info in complete_devices.items():
                reflector = info["name"]
                if reflector in reflector_positions:
                    avg_ifft = np.mean(info["ifft"])
                    measurements[reflector] = avg_ifft
                    print(f"  Device {dev_id}  ({reflector})  →  Afstanden: {info['ifft']}  → Gemiddelde: {avg_ifft:.3f}")


            # Trilateratie
            # estimated_pos = trilaterate(reflector_positions, measurements)

            # Multilateratie
            estimated_pos = multilateration_2d(
                anchors=list(measurements.keys()),
                ranges=list(measurements.values()),
                anchors_pos=reflector_positions
            )

            # Oude cirkels wissen
            for c in range_circles:
                c.remove()
            range_circles.clear()

            # Nieuwe cirkels tekenen
            for name, dist in measurements.items():
                if name in reflector_positions:
                    bx, by, _ = reflector_positions[name]
                    circle = plt.Circle((bx, by), dist, color='r', fill=False, linestyle='--', alpha=0.5)
                    ax.add_patch(circle)
                    range_circles.append(circle)

            # Geschatte positie
            position_dot.set_data([], [])
            if estimated_pos is not None:
                x, y = float(estimated_pos[0]), float(estimated_pos[1])
                position_dot.set_data([x], [y])
                print(f"\nLokalisatie: {estimated_pos}, met {len(measurements)} devices")

            fig.canvas.draw()


            # Reset voor volgende meting
            device_data = {}
            current_device = None
            current_reflector = None


        plt.show()

    except KeyboardInterrupt:
        print("LOCALISATIE gestopt.")
        break
if someone could help me with this, i would be VERY happy!
kind regards,
Nick De Leenheer

