Trying to make Thingy91's asset_tracker_v2 light sensor (BH1749) data to show up in a card on Dashboard in nrfcloud.
By default asset_tracker_v2 code supporting light sensor reports it as
#define APP_ID_LIGHT_THRESHOLD "LIGHT_THRESHOLD_EXCEEDED"
But since there is no card for LIGHT_THRESHOLD_EXCEEDED
we changed it to
#define APP_ID_LIGHT_THRESHOLD "LIGHT"
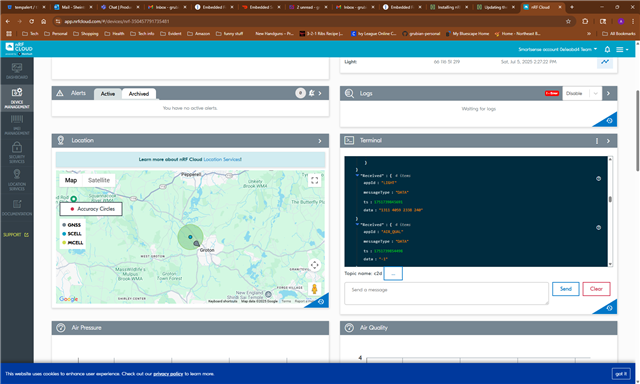
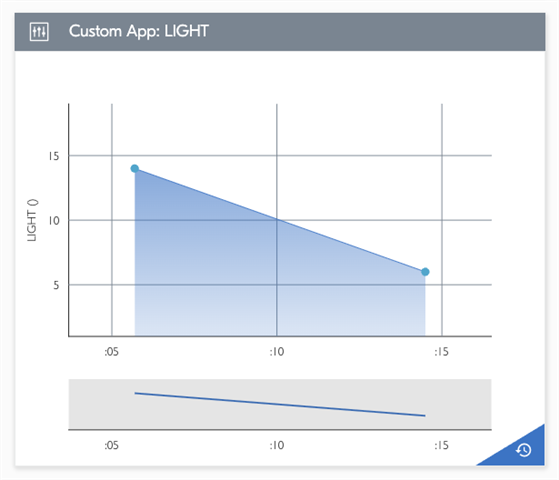
After this change - data shows up in LIGHT card, but only the event count (see attached screenshots).
We would like to see chart of timestamped R/G/B/IR datapoints,
Hence the question - how do we make it show up as a chart of datapoints with timestamps ?