BLE Advertising on nRF54L15DK consuming more than Online Power Profiler suggests

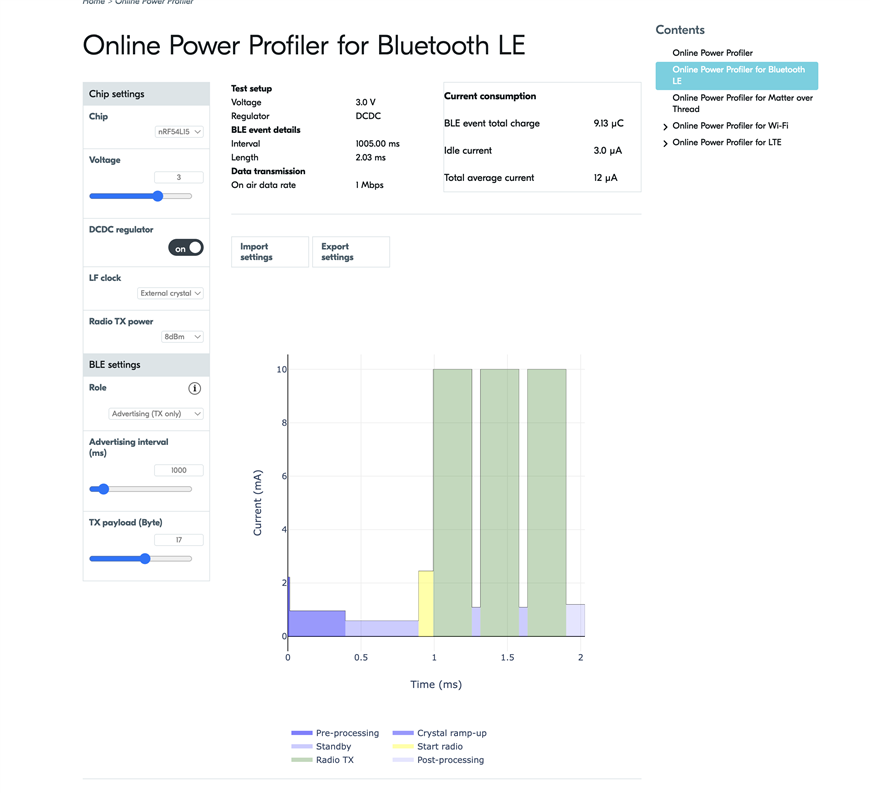
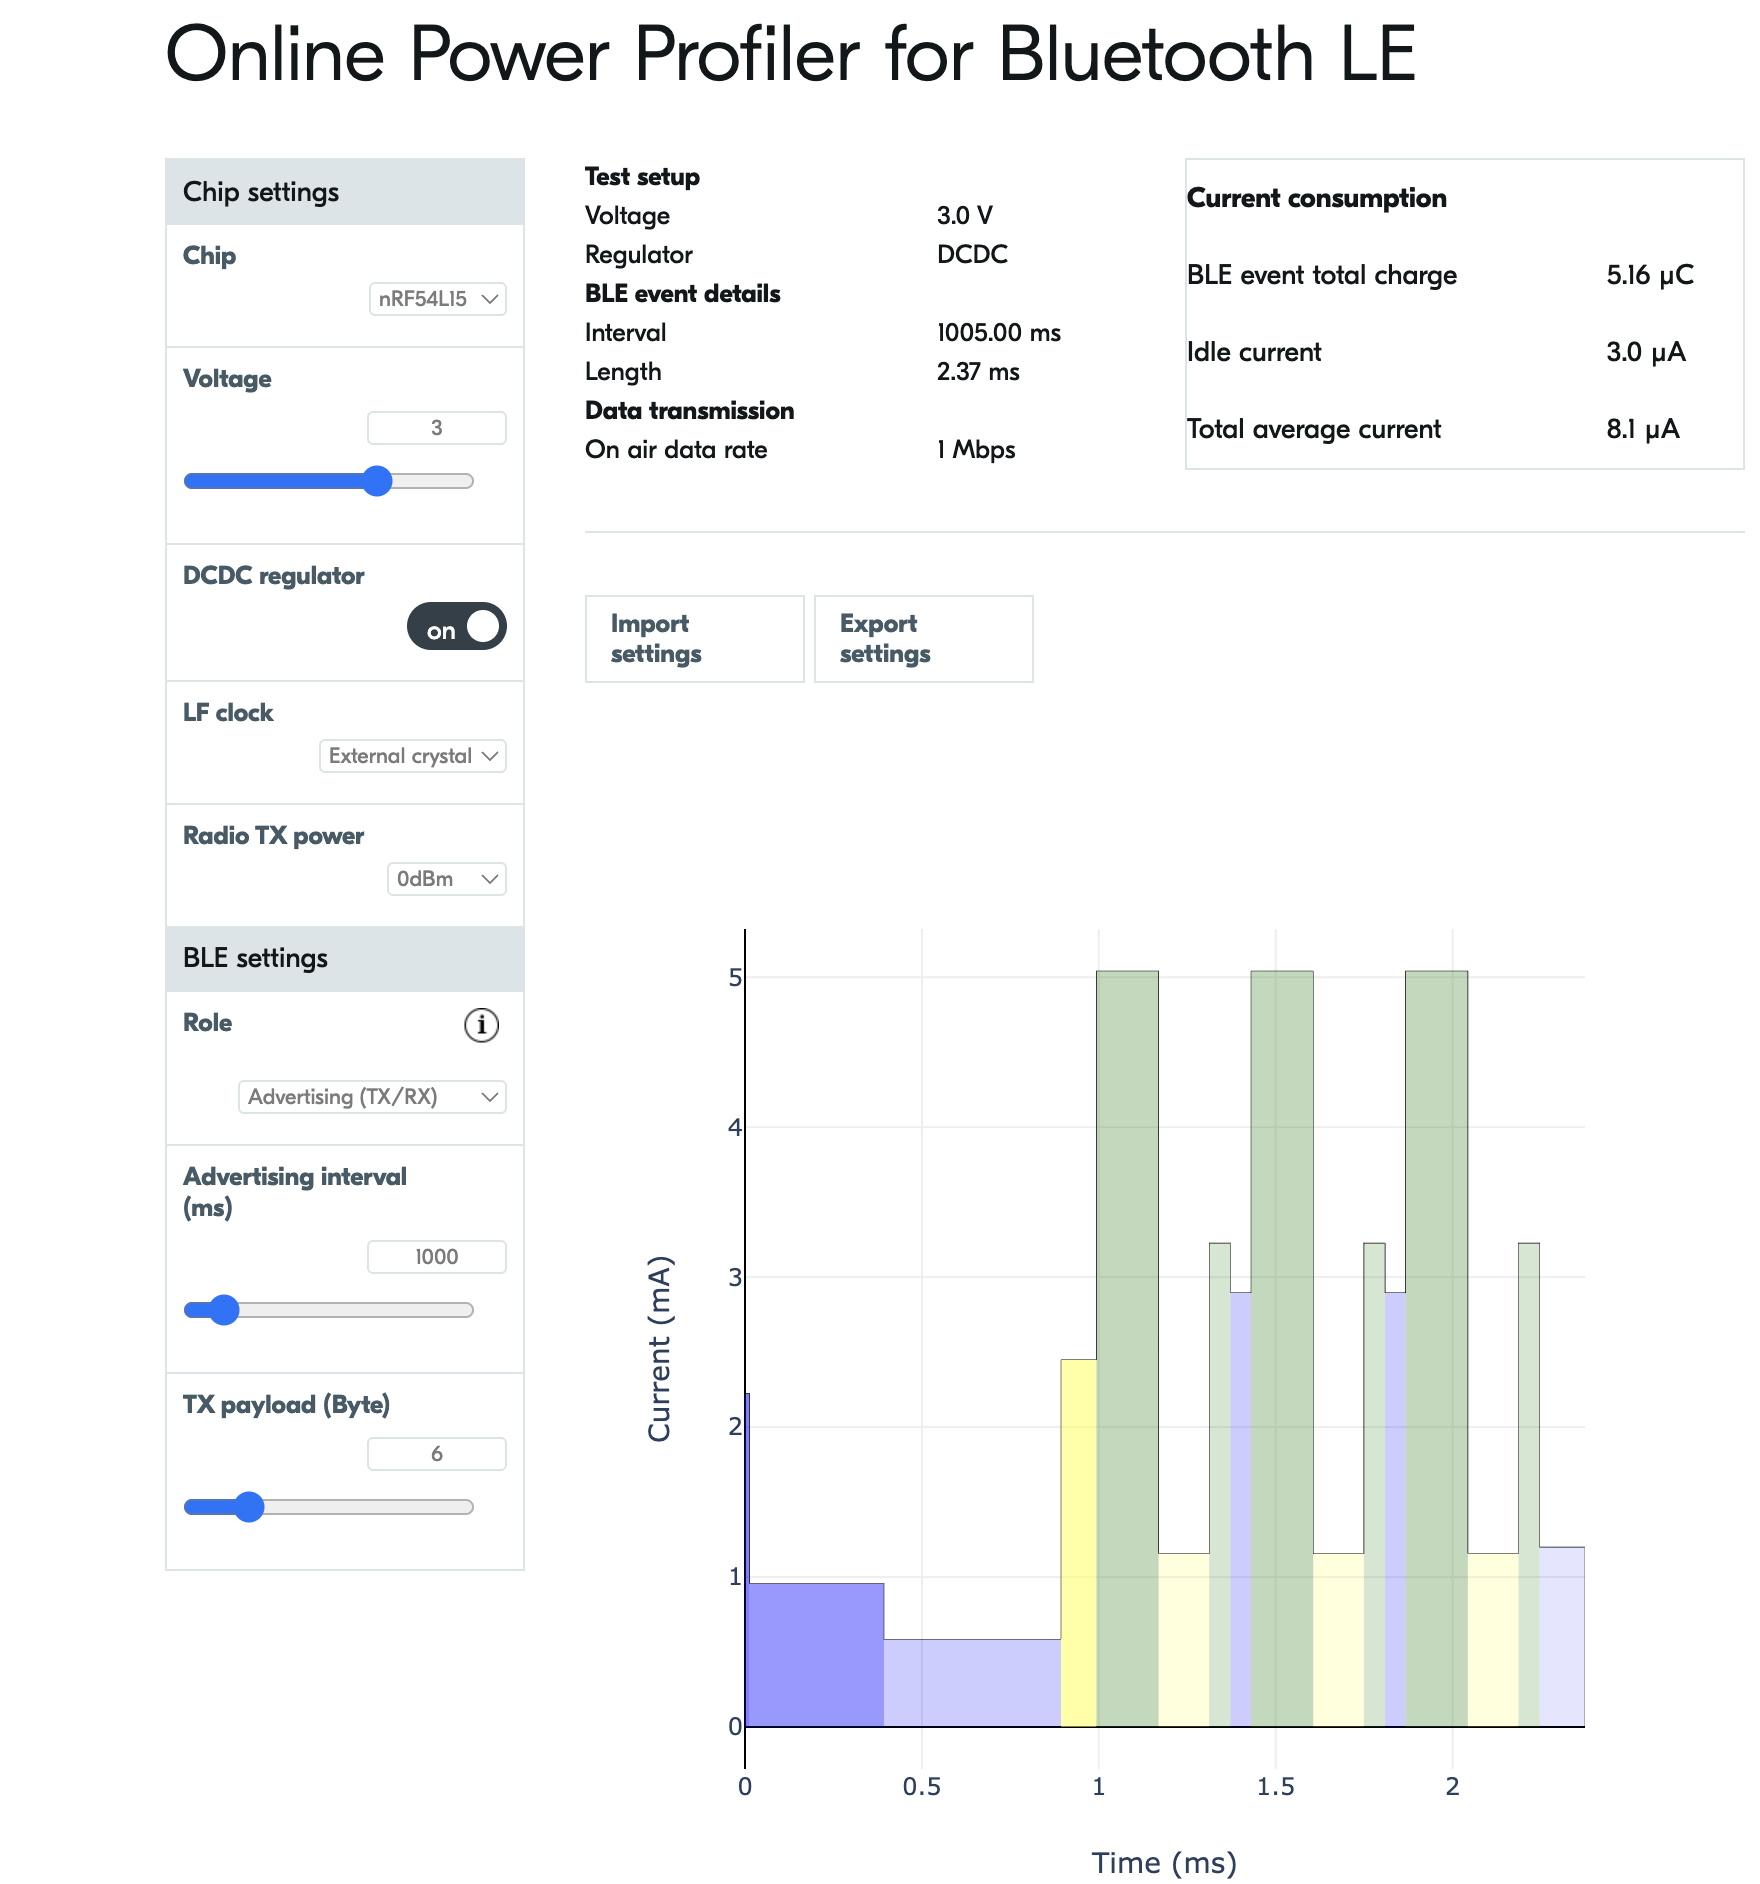
Hi, I was using the BLE online power profiler to determine possible power savings with the nRF54L15DK over the nRF52840 using the zephyr bluetooth broadcaster sample. The profiler suggests that when ble advertising at 0dBm every 1s, the total average current should be around 8.1uA.

I attempted to recreate these numbers by modifying the zephyr broadcaster sample:

- added CONFIG_PM_DEVICE=y and CONFIG_PM_DEVICE_RUNTIME=y
- set CONFIG_SERIAL=n
- set CONFIG_RAM_POWER_DOWN_LIBRARY=y and disabled unused RAM in main()
- changed application to turn on advertising @1 second and exit
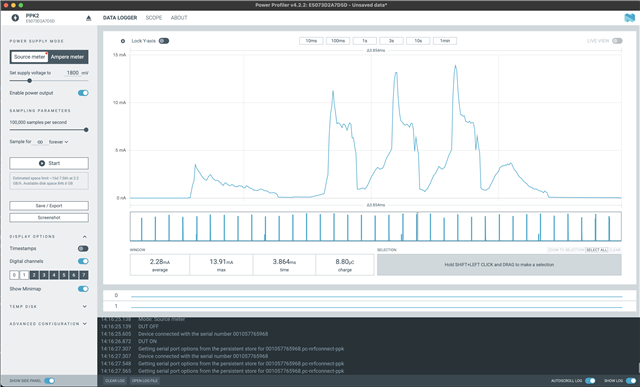
- attached a PPK2 in ammeter mode to the devkit pins on P6

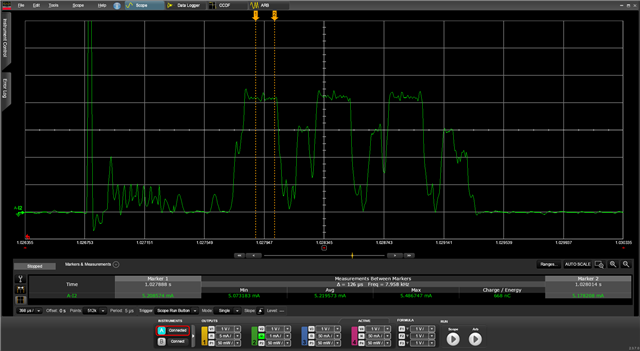
The power consumption seems much higher than what the online power profiler claims:

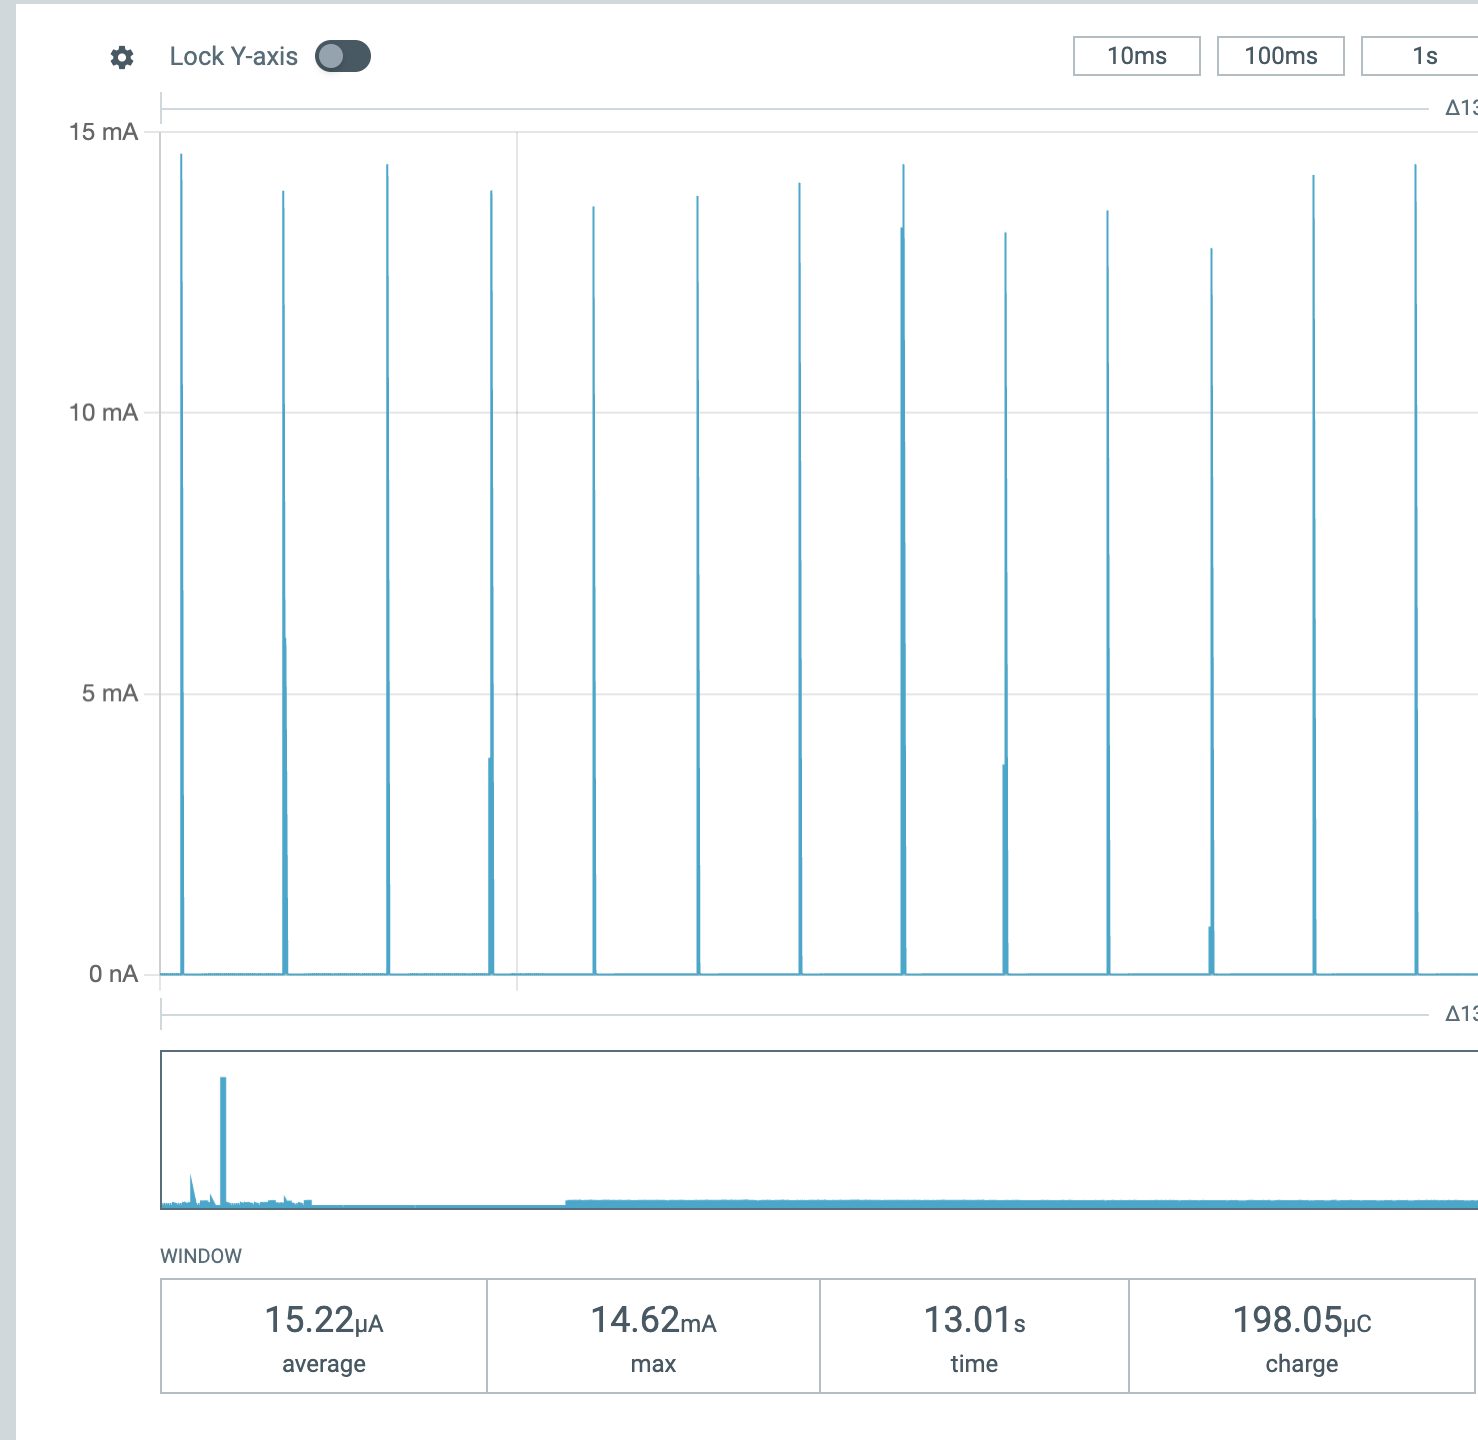
Idle current seems about right, hovering around 3.2uA, but the power spikes during advertising are far greater than what the power profiler suggests

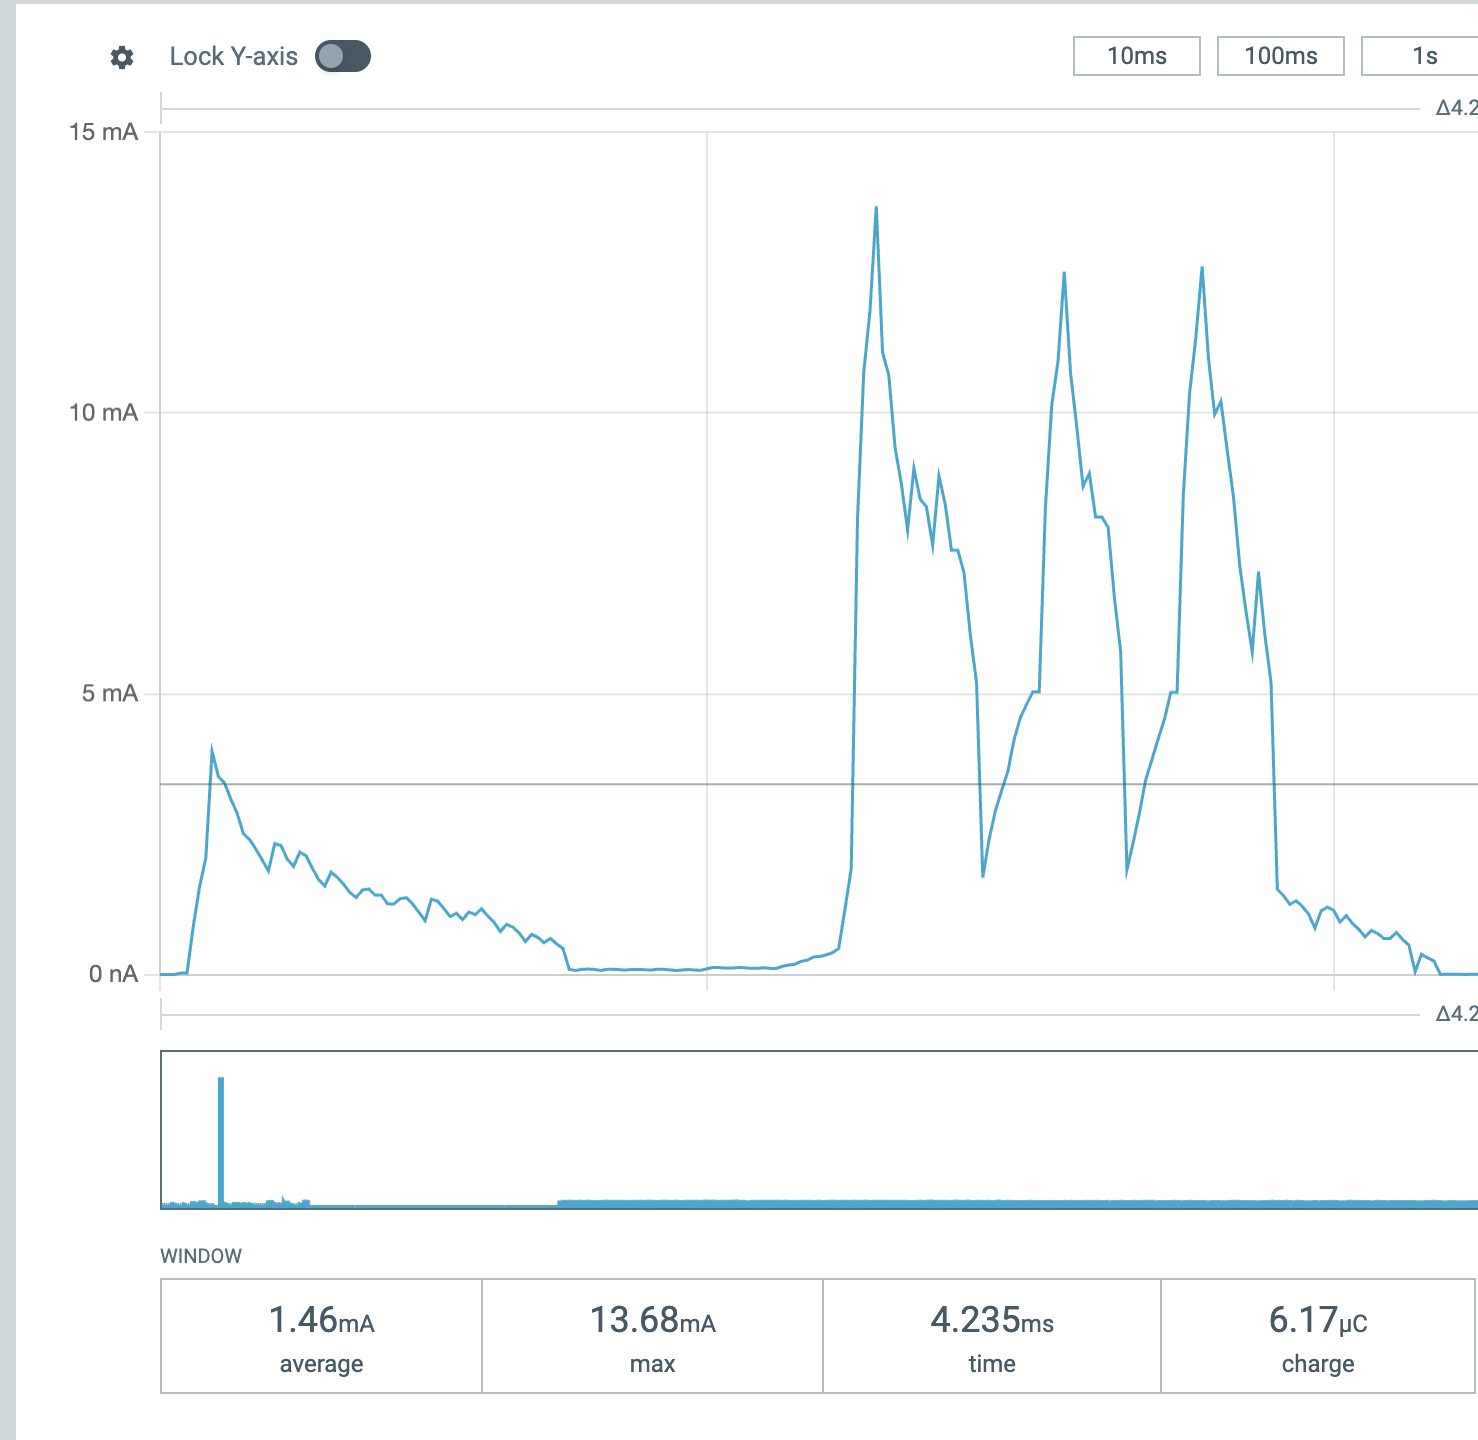
The TX peaks seem to average ~10mA which is double what is expected. Even if I was accidentally broadcasting at 8dBm the power profiler claims i should only be consuming 11uA total. Is there some configuration i'm missing? How can I achieve the same results as the power profiler?

Parents
  • Hello,

    The default VDD supply is 1.8v on the DK so that will certainly have some impact on the measurement results. You can change this via the board configurator app here https://docs.nordicsemi.com/bundle/nrf-connect-board-configurator/page/index.html. The power profiler should also set to advertising(tx only) as the brodcast sample appears to use non-scannable adv. packets. That said, your results still seems to be bit high. Maybe try with one of the samples included in the posts below to see if we can get comparable results.

     -  RE: Not able to achieve minimum sleep current on NRF54L15 

    -   sample BLE beacon app for measuring energy consumption  

    Best regards,

    Vidar

  • Thanks Vidar, I tried the BLE beacon app that you linked but my current consumption was still a bit higher than the power profiler. In the PPK screenshot you posted you were seeing avg 13.59uA current draw which is still a bit higher than expected. With the online power profiler 13uA is suggested after setting power to 8dBm so it seems like even your sample app is over the estimated current. (+TX payload should be 16 for 14 byte name + 2 byte header)

    VDD being 1.8V on the DK by default certainly changes my power calculations and we're now seeing a 30-50% power reduction when compared to the same app running on the nRF52840DK which is nice. Can the rest be chalked up to modelling/measurement error?

  • Hi, to me the PPK plots you shared seem a bit strange. I believe it could be due to the automatic range switching, and what you are seeing is inrush current when it switches the measuring shunt. 

    Here is a plot of one advertising event using the perpiheral_lbs sample in the sdk. As you can see the TX peaks looks much more clean with a keysight power analyzer. The TX peak current is at 5.2mA, which is a bit higher than the 0dBm TX in the online power profiler (5.0mA), but I believe that is within device to device variation. Matching network and the frequency will have an impact on the TX current.

    Over a one second average I get 9.7uA

    The payload is 11 bytes, output power is 0dBm and voltage is 3.0V

    Here is the hex file if you want to compare with your measurement setup: 7446.merged.hex

    The changes I did to this sample was to

    • disable UART in the prj.conf file. CONFIG_SERIAL=n.
    • Turn off LED blinking (just comment out in main.c) There are pulldowns on the LED pins that will cause some extra leakage if the pins are high.
    • Turn off scan response, as it is more reliable when measuring current. And it is easier to calculate the payload on each TX. You should also check in the measurement plot that there are no scan requests or connection requests on the RX, in that case you will get an extra TX spike after RX.
Reply
  • Hi, to me the PPK plots you shared seem a bit strange. I believe it could be due to the automatic range switching, and what you are seeing is inrush current when it switches the measuring shunt. 

    Here is a plot of one advertising event using the perpiheral_lbs sample in the sdk. As you can see the TX peaks looks much more clean with a keysight power analyzer. The TX peak current is at 5.2mA, which is a bit higher than the 0dBm TX in the online power profiler (5.0mA), but I believe that is within device to device variation. Matching network and the frequency will have an impact on the TX current.

    Over a one second average I get 9.7uA

    The payload is 11 bytes, output power is 0dBm and voltage is 3.0V

    Here is the hex file if you want to compare with your measurement setup: 7446.merged.hex

    The changes I did to this sample was to

    • disable UART in the prj.conf file. CONFIG_SERIAL=n.
    • Turn off LED blinking (just comment out in main.c) There are pulldowns on the LED pins that will cause some extra leakage if the pins are high.
    • Turn off scan response, as it is more reliable when measuring current. And it is easier to calculate the payload on each TX. You should also check in the measurement plot that there are no scan requests or connection requests on the RX, in that case you will get an extra TX spike after RX.
Children
  • Hi Stian,

    There does seem to be some disparity between the trace on your keysight analyzer vs what I see on the PPK with the build you sent me. I still see ~14uA average over a few seconds:

    I see the PPK2 has some inrush current when measuring rf spikes since it has to dynamically switch shunts so it's overestimating the BLE advertising current. Will keep that in mind when taking future measurements.

Related