Getting RTT Logging with J-Link Probe and nRF54L15DK

It would be extremely useful to get the HCI Traces (BLE) of my nRF54L15 boards. Documentations: Embedded HCI Tracing

For simplicity's sake, here is my setup:
- nRF54L15DK
- Segger J-Link Debugger
- J-Link Adapter CortexM
- 10-pin 2x5 Socket-Socket 1.27mm IDC (SWD) Cable
(Pictured below)


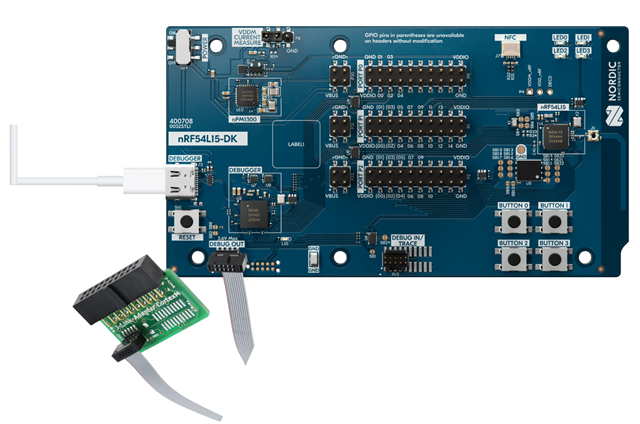
I can quite simply access the HCI Traces using (in the .conf file):

CONFIG_BT_DEBUG_MONITOR_UART=y


But this is very problematic, as it prevents the usage of that serial port.

So this leaves me with 2 possible solutions (?)

- Find a way to use the VCOM0 (The serial port that doesn't end with a 3)
or
- Use  CONFIG_BT_DEBUG_MONITOR_RTT

But I can't seem to get the J-Link Probe to work with


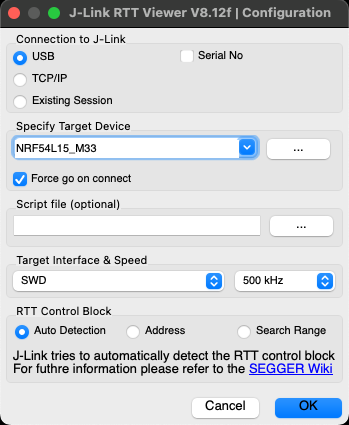
Is there a different intended way to use RTT with these boards?

My end goal really is only to obtain the HCI Trace, so if there is a simpler way that does prevent the usage of the VCOM1, it could also be an ideal solution

Parents
  • Hello,

    ''
    - Find a way to use the VCOM0 (The serial port that doesn't end with a 3)''

    yes, in principle you can do this, dedicate one UART (e.g., VCOM0) for HCI tracing and other one is for your application logs. You need to configure your firmware so that the HCI trace output is routed to the UART instance connected to VCOM0.

    ''But I can't seem to get the J-Link Probe to work with''

    For the second one, you can check that you are using the latest version of the jlink RTT software and debugger is correctly connected to the PC.

    To capture and decode these traces, you should use the btmon tool from BlueZ with the --jlink option, specifying your device and serial number. For example:

    btmon --jlink nRF54L15_xxAA,<your_jlink_serial_number>

Reply
  • Hello,

    ''
    - Find a way to use the VCOM0 (The serial port that doesn't end with a 3)''

    yes, in principle you can do this, dedicate one UART (e.g., VCOM0) for HCI tracing and other one is for your application logs. You need to configure your firmware so that the HCI trace output is routed to the UART instance connected to VCOM0.

    ''But I can't seem to get the J-Link Probe to work with''

    For the second one, you can check that you are using the latest version of the jlink RTT software and debugger is correctly connected to the PC.

    To capture and decode these traces, you should use the btmon tool from BlueZ with the --jlink option, specifying your device and serial number. For example:

    btmon --jlink nRF54L15_xxAA,<your_jlink_serial_number>

Children
No Data
Related