We have a locator-beacon setup based on this https://docs.nordicsemi.com/bundle/ncs-2.9.1/page/nrf/samples/bluetooth/direction_finding_connectionless_tx/README.html running AoA mode. We are running nRF Connect SDK v 2.9.1.
We are using the antenna pattern { 0x5, 0x6, 0x4, 0x9, 0xA, 0x8, 0xD, 0xE, 0xC, 0x1, 0x2, 0x0 }
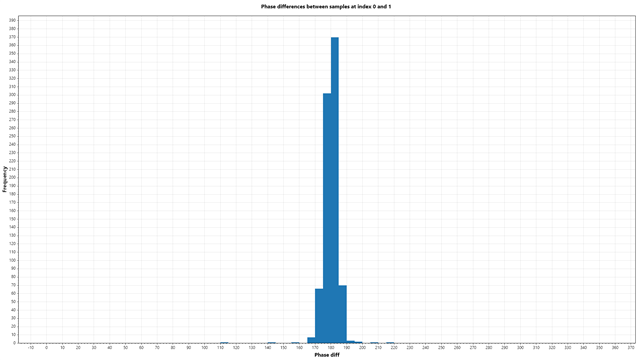
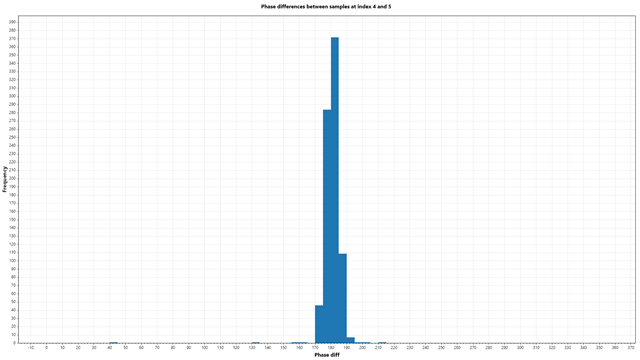
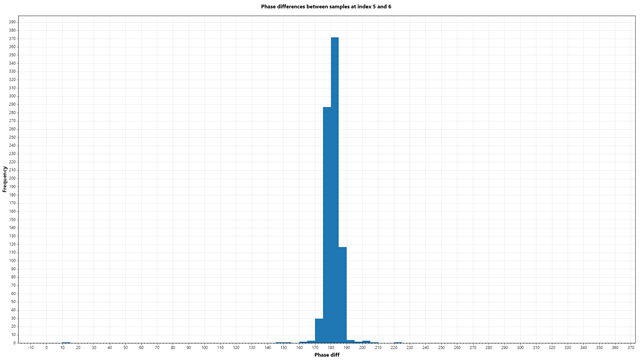
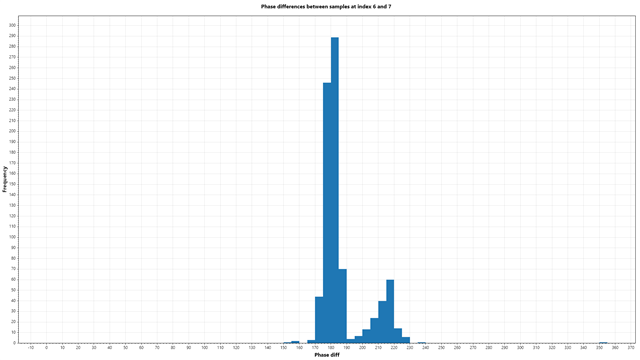
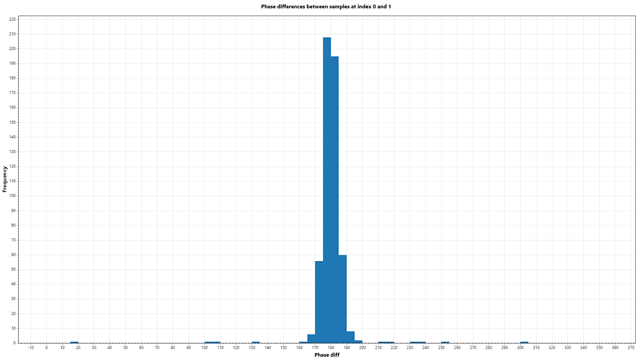
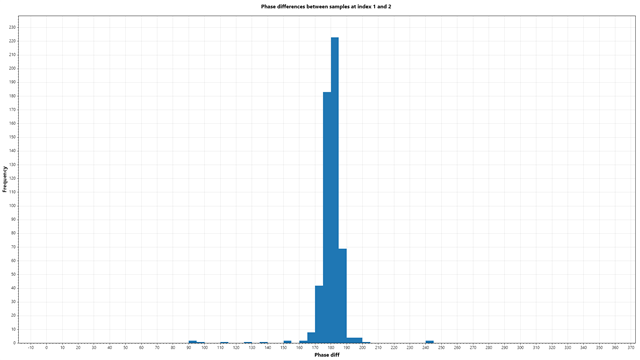
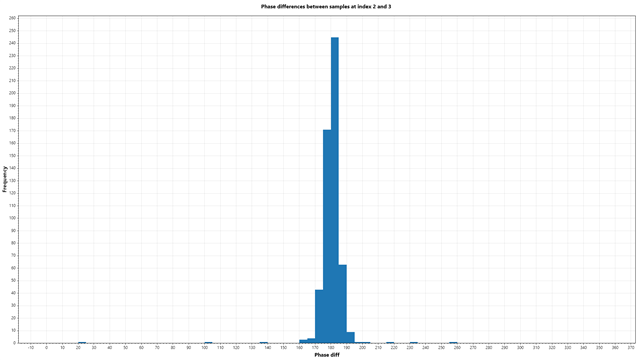
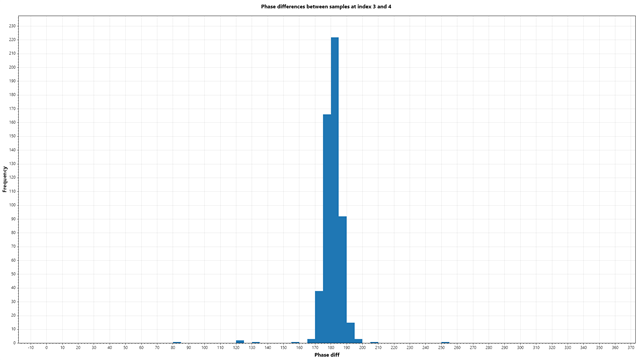
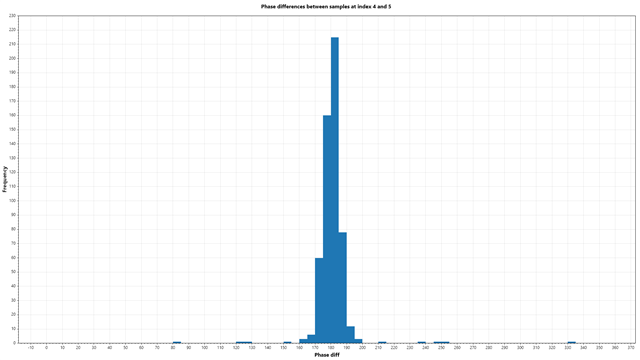
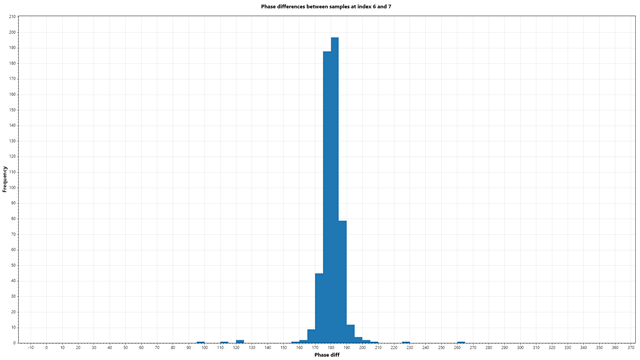
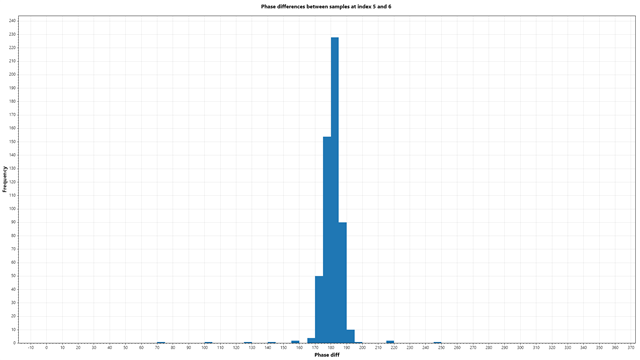
When analyzing the I/Q data from the reference period (8 samples), we expect the phase of the data to be different for each sample. However since they are being sampled from the same antenna, and the time interval is the same between all reference samples, we expect the phase to change by the same amount between each reference sample. To ensure this is working properly, we tested measuring 500 times. For each of these, we had 8 samples from the reference period. This gave us 7 "phase differences" per measurement, the phase difference between reference sample 0 and 1, between reference sample 1 and 2, all the way up to the phase difference between reference sample 6 and 7. When plotting these phase differences, we expect them all to be roughly the same. And here are the results, showing the phase differences between consecutive samples at the different indices:
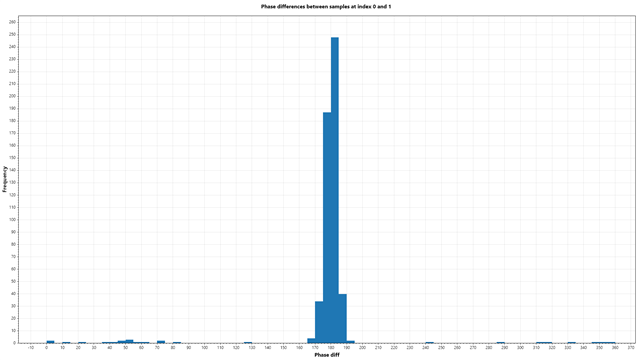
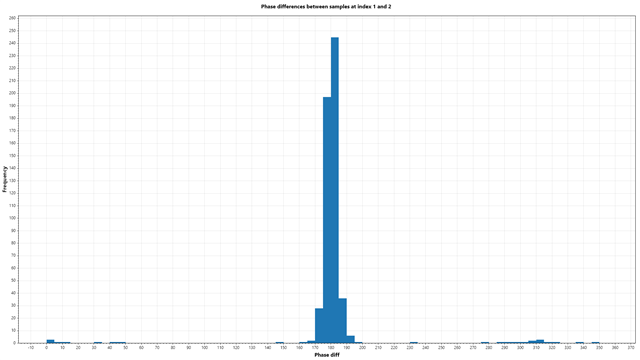
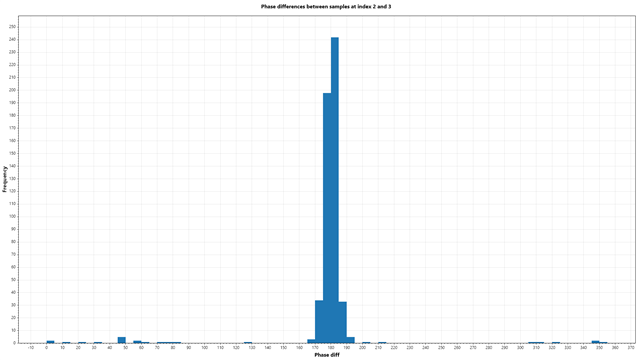
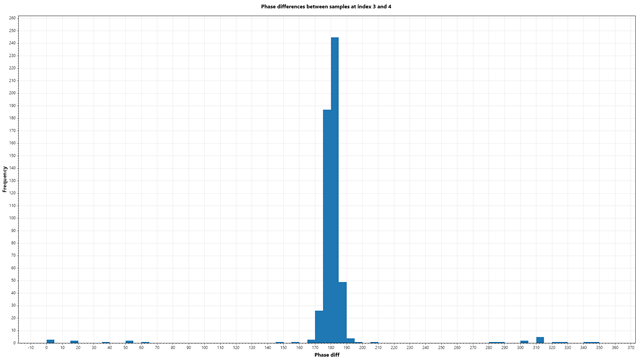
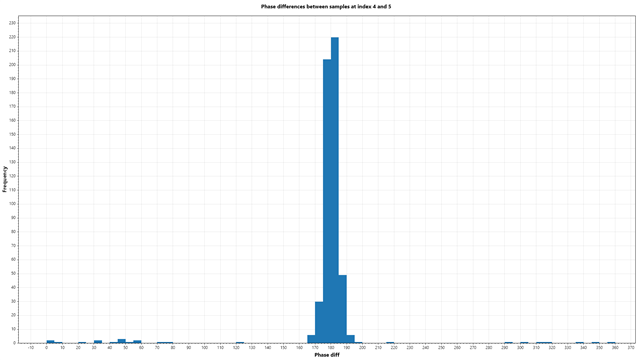
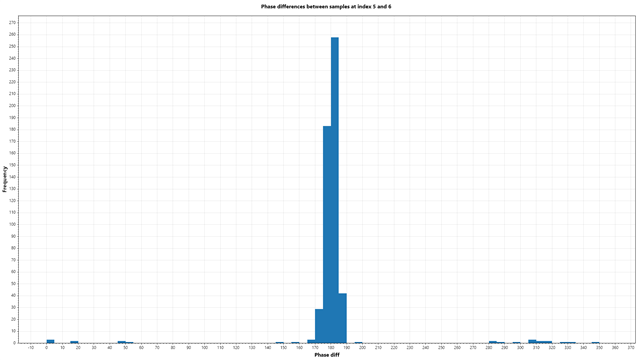
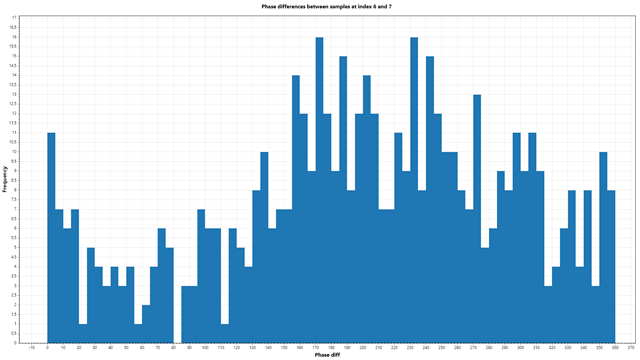
For the first 7 reference samples, the difference between consecutive samples seem to always be roughly the same. However something weird happens when we compare the phase of the 7th and 8th reference sample. It seems to be essentially random. We don't understand what is going on here. We don't think we can blame it on "noise", because why would this only affect the last reference sample? Any ideas what could be causing this, or is it expected to look like this?