
Hello,
whenever I try to debug my nRF Connect SDK application, I have problems with the nRF Connect for VSCode debugger in such an extent, that I can't use it.
When I have started the debugger It breaks at the beginning of the main function, as expected. I resume the execution there and the program executes as expected.
When I now try to add a new breakpoint somewhere in my code (even in a function, that isn't exeucted atm)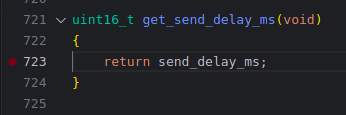
I get an instant kernel panic.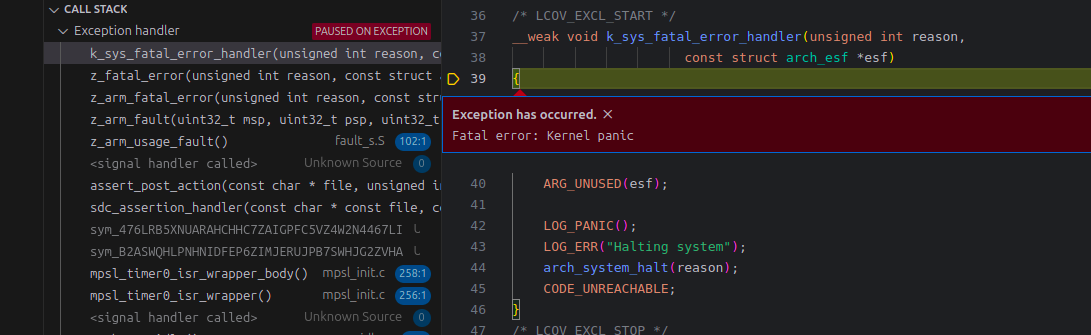
Sometimes the breakpoint I added (in this example to line 723) shows up in a completely different line than where I clicked (for example line 740).
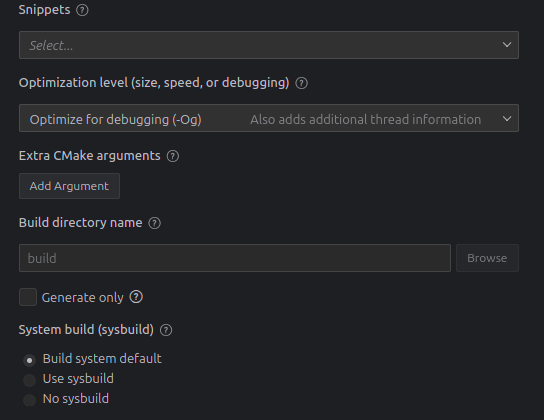
I have enabled debugging both in my prj.conf and in the vs code plugins app configuration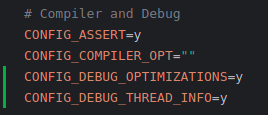
I have tried with and without sysbuild but it's always the same problem.
Is there anything I am missing?
