
Hi,
I am facing hardfault when i try to enable low power in a ble application. i want to enable trace on my PCA10040 board to find out the cause of this hardfault. can you help me to succeed to enable trace ? please.
Best regards.
Hi,
I am facing hardfault when i try to enable low power in a ble application. i want to enable trace on my PCA10040 board to find out the cause of this hardfault. can you help me to succeed to enable trace ? please.
Best regards.
Unfortunately, the j-link plus does not appear to support trace. Does the call stack provide any clues as to what function caused the hardfault? I.e, are there any function calls on the stack prior to the hardfault? You can also get the PC value before the exception occurred by reading the memory at the current stackpointer pluss an offset of 24 bytes (SP+24).
Also you can just insert breakpoints and determine how far the application gets before the exception occurs. With this you should be able to locate the code that triggers it.
EDIT - Attached screen dump for illustration
The function call prior to the exception will generally be shown if it occurred in the application code. Also see that the address of the instruction that caused the hardfault is loaded to R0, but not sure if that is always the case.
To illustrate this I triggered a hardfault exception by accessing an invalid memory area in the battery_level_update function found in the hrs example.
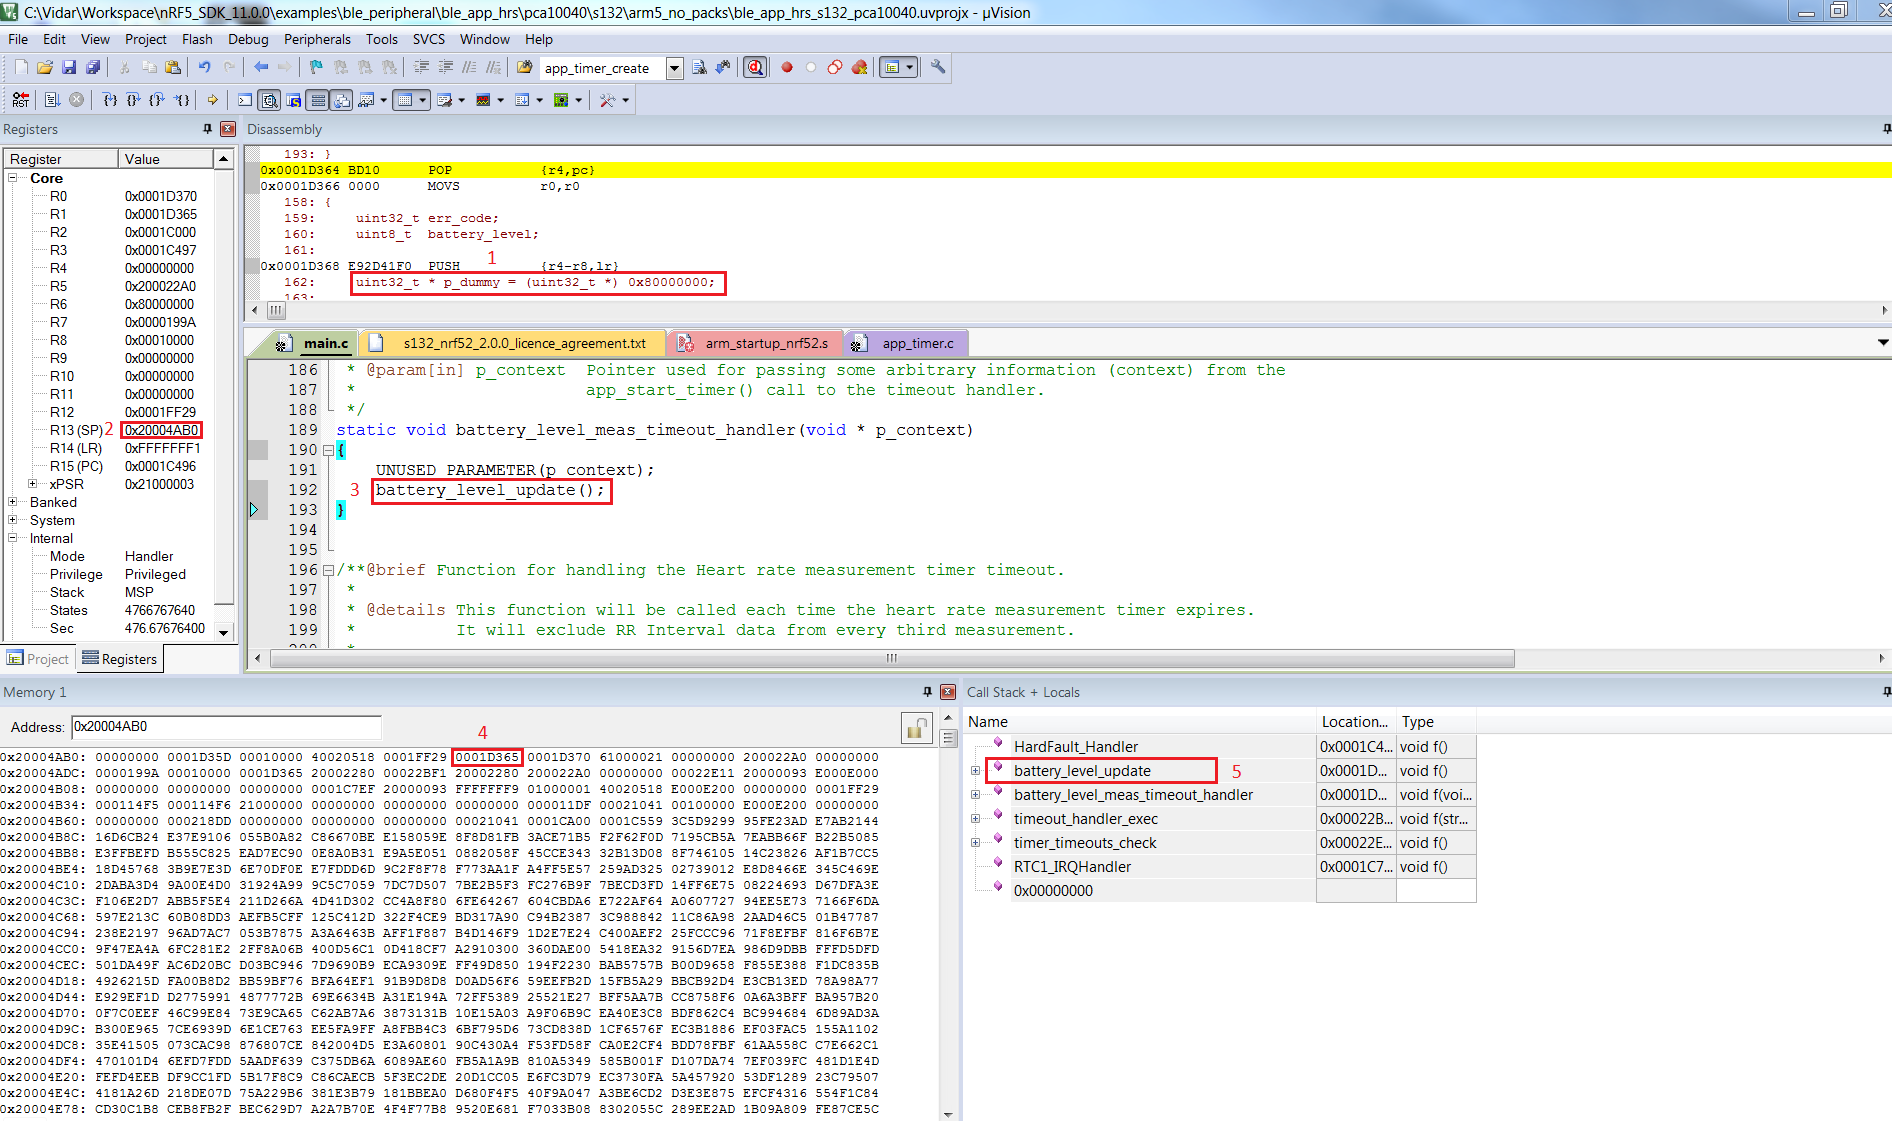
You can download the image to enlarge it.
Unfortunately, the j-link plus does not appear to support trace. Does the call stack provide any clues as to what function caused the hardfault? I.e, are there any function calls on the stack prior to the hardfault? You can also get the PC value before the exception occurred by reading the memory at the current stackpointer pluss an offset of 24 bytes (SP+24).
Also you can just insert breakpoints and determine how far the application gets before the exception occurs. With this you should be able to locate the code that triggers it.
EDIT - Attached screen dump for illustration
The function call prior to the exception will generally be shown if it occurred in the application code. Also see that the address of the instruction that caused the hardfault is loaded to R0, but not sure if that is always the case.
To illustrate this I triggered a hardfault exception by accessing an invalid memory area in the battery_level_update function found in the hrs example.
You can download the image to enlarge it.

Thank you for your reply. How can i display call stack? I can't insert breakpoints since the hardfault is random.
i am unable to reproduce the hardfault with debug session !!!

Strange. how did you conclude it was a hardfault earlier? Halting the core with nrfjprog/jlink, or did you have a LED or similar in the event handler?
Overview of my Ble application:
.
.
.
BleInit();
uart_init();
printf("%s",start_string);
DisplayInit();
NorFlashInit();
//scheduler init
APP_SCHED_INIT(SCHED_MAX_EVENT_DATA_SIZE, SCHED_QUEUE_SIZE);

//create Display timer
err_code = app_timer_create(&DisplayTimerId,	APP_TIMER_MODE_REPEATED,	DisplayEventHandler);
APP_ERROR_CHECK(err_code);

while (1)
{
	app_sched_execute();
	power_manage();

}
when proc is idle mode i measure a consumption current of~900uA, run mode ~6mA.
Hardfault occurs randomly (on connect event, display event ...etc) when it occurs i measure a consumption current of 10mA, and ble stops advertising.
To be sure that is a hardfault, i replaced
HardFault_Handler\
                PROC
                EXPORT  HardFault_Handler         [WEAK]
                B       .
                ENDP
on arm_startup_nrf52.s by Reset_Handler code
HardFault_Handler\
                PROC
                EXPORT  Reset_Handler             [WEAK]
                IMPORT  SystemInit
                IMPORT  __main

                LDR     R0, =SystemInit
                BLX     R0
                LDR     R0, =__main
                BX      R0
                ENDP
then when the hardfault occurs, the board resets