How to achieve stable unfiltered ADC readings on nRF54L15 ?

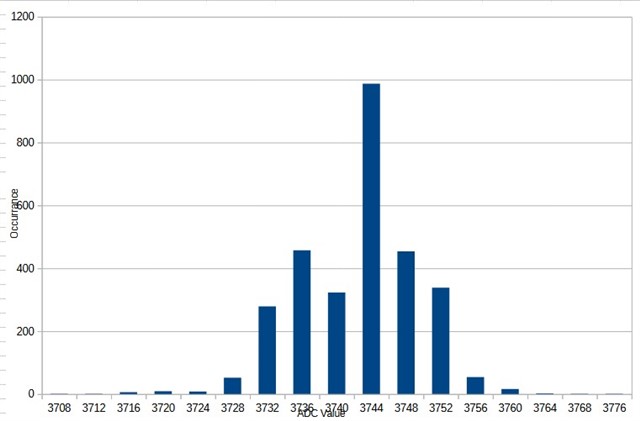
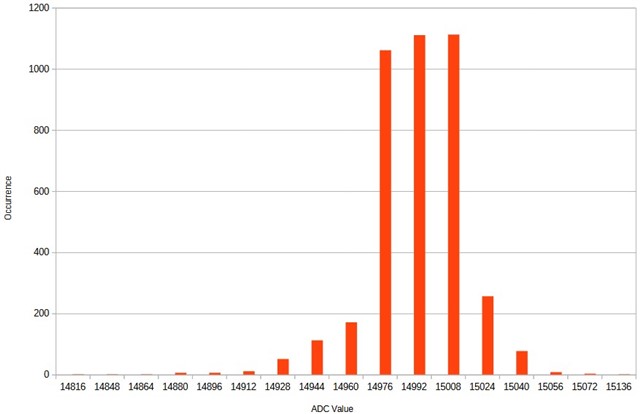
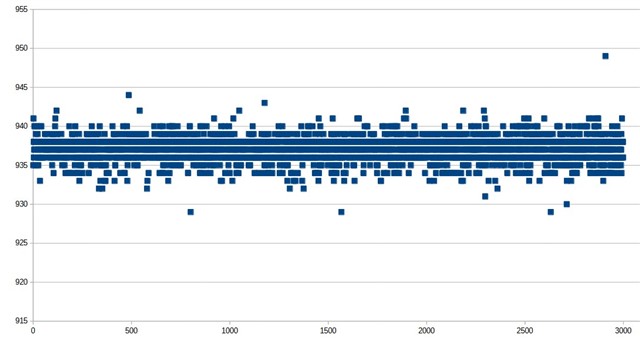
I'm struggling to obtain stable ADC readings on the nRF54L15, and I'd appreciate any suggestions. I have the ADC configured with gain = 1, internal reference, 10 bit resolution, and I've tried both the default acquisition time (ie 0) and a longer acquisition time of 5us. I'm using the nRF54L15 DK board, and I've powered the nRF54L15 both from the onboard PMIC, and also from an external 3V battery (to eliminate the possibility of PMIC noise affecting the ADC readings). I'm applying a highly stable low impedance 819.2 mV DC signal to input ADIN4 (P1.11) in a temperature-stable environment of 20 degrees C. I collect ADC samples for an hour and then plot them. The plots look like this:

Yes I'm aware I can filter these, but the starting point is to obtain clean data before filtering. We would prefer not to filter at all, because filtering takes time, and in our application we need to detect and capture transient events which filtering would mask out.

Is the above raw ADC sampling considered normal for this part? 

Any suggestions on how to improve this performance (without filtering)?

Thanks.

Parents
  • I thought folks might be interested in seeing this. I switched to so-called 12-bit mode. Gathered a bunch of samples with the stable input voltage mentioned above. But plotted the ADC values differently. This plot has the ADC value on the X axis, and the number of samples of that value (the occurrence count) on the Y axis.


    As can be readily seen, the ADC values step by 4. 3732, 3736, 3740, ...

    The "12-bit mode" appears to simply be the raw 10-bit mode shifted left by 2 bits. It does not contain any more information than the 10 bit mode. If this claimed to be a 12-bit ADC, we would say it has a lot of missing codes. Noise (variation from the mean) looks to be approximately the same as 10-bit mode (although multiplied by 4).

    And, to wrap up this little investigation (I think anyway), here's a similar graph for so-called 14-bit mode, with 10us acquisition. Dataset size is a little larger than the previous two sets.


    Now we see the ADC values are spaced 16 counts apart. 14-bit values but only 10 bits worth of actual values returned. However the apparent noise (variation from the mean) is less (when divided by 16), so we can see the benefit of using this mode.

Reply
  • I thought folks might be interested in seeing this. I switched to so-called 12-bit mode. Gathered a bunch of samples with the stable input voltage mentioned above. But plotted the ADC values differently. This plot has the ADC value on the X axis, and the number of samples of that value (the occurrence count) on the Y axis.


    As can be readily seen, the ADC values step by 4. 3732, 3736, 3740, ...

    The "12-bit mode" appears to simply be the raw 10-bit mode shifted left by 2 bits. It does not contain any more information than the 10 bit mode. If this claimed to be a 12-bit ADC, we would say it has a lot of missing codes. Noise (variation from the mean) looks to be approximately the same as 10-bit mode (although multiplied by 4).

    And, to wrap up this little investigation (I think anyway), here's a similar graph for so-called 14-bit mode, with 10us acquisition. Dataset size is a little larger than the previous two sets.


    Now we see the ADC values are spaced 16 counts apart. 14-bit values but only 10 bits worth of actual values returned. However the apparent noise (variation from the mean) is less (when divided by 16), so we can see the benefit of using this mode.

Children
No Data
Related