
nRF9151 has access port protection enabled by default. I need to debug firmware for nRF9151 produced by a non-secure build. I am trying to follow Figure 120 (Access port unlocking) from the datasheet,
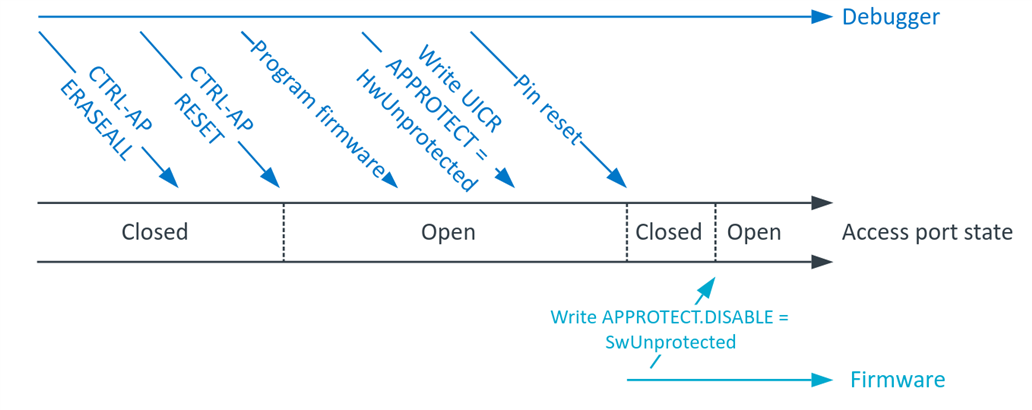
interpreting each instruction as following:
0. Connecting to the board through JLink
J-Link> connect
1. CTRL-AP ERASEALL
CTRL_AP_PERI base address: 0x50006000
CTRL-AP RESET offset: 0x0
CTRL-AP RESET address: 0x50006000
J-Link> Write4 0x50006000 1
2. CTRL-AP RESET
CTRL_AP_PERI base address: 0x50006000
CTRL-AP ERASEALL offset: 0x4
CTRL-AP ERASEALL offset: 0x50006004
J-Link> Write4 0x50006004 1
3. Program firmware
J-Link> loadbin build/merged.hex 0
4. Write UICR APPROTECT = HwUnprotected
UICR base address: 0x00FF8000, APPROTECT offset: 0x0, HwUnprotected 0x50FA50FA
J-Link> Write4 0x00FF8000 0x50FA50FA
5. Pin reset
When I select RSetType 2 = RESETPIN (Resets core & peripherals using RESET pin.), I get a long error:
J-Link>RSetType 2
Reset type: RESETPIN (https://kb.segger.com/J-Link_Reset_Strategies)
J-Link>Reset
Reset delay: 0 ms

****** Error: Timeout while erasing sectors  @0x00FF8000, RAMCode did not respond in time!
Failed to erase sectors.

Reset type: RESETPIN (https://kb.segger.com/J-Link_Reset_Strategies)
Reset: Halt core after reset via DEMCR.VC_CORERESET.
Reset: Reset device via reset pin
Reset: VC_CORERESET did not halt CPU. (Debug logic also reset by reset pin?).
Reset: Reconnecting and manually halting CPU.
Found SW-DP with ID 0x6BA02477
DPIDR: 0x6BA02477
CoreSight SoC-400 or earlier
AP map detection skipped. Manually configured AP map found.
AP[0]: AHB-AP (IDR: Not set, ADDR: 0x00000000)
AP[0]: Skipped. Could not read CPUID register
Attach to CPU failed. Executing connect under reset.
Failed to power up DAP
CPU could not be halted
Reset: Core did not halt after reset, trying to disable WDT.
Reset: Halt core after reset via DEMCR.VC_CORERESET.
Reset: Reset device via reset pin
Reset: VC_CORERESET did not halt CPU. (Debug logic also reset by reset pin?).
Reset: Reconnecting and manually halting CPU.
Found SW-DP with ID 0x6BA02477
DPIDR: 0x6BA02477
CoreSight SoC-400 or earlier
AP map detection skipped. Manually configured AP map found.
AP[0]: AHB-AP (IDR: Not set, ADDR: 0x00000000)
AP[0]: Skipped. Could not read CPUID register
Attach to CPU failed. Executing connect under reset.
Failed to power up DAP
CPU could not be halted
Reset: Failed. Toggling reset pin and trying reset strategy again.
Failed to attach to CPU. Trying connect under reset.
Found SW-DP with ID 0x6BA02477
SWD speed too high. Reduced from 4000 kHz to 2700 kHz for stability
DPIDR: 0x6BA02477
CoreSight SoC-400 or earlier
AP map detection skipped. Manually configured AP map found.
AP[0]: AHB-AP (IDR: Not set, ADDR: 0x00000000)
AP[0]: Skipped. Could not read CPUID register
Attach to CPU failed. Executing connect under reset.
Failed to power up DAP
Reset: Halt core after reset via DEMCR.VC_CORERESET.
Reset: Reset device via reset pin
Reset: VC_CORERESET did not halt CPU. (Debug logic also reset by reset pin?).
Reset: Reconnecting and manually halting CPU.
Found SW-DP with ID 0x6BA02477
DPIDR: 0x6BA02477
CoreSight SoC-400 or earlier
AP map detection skipped. Manually configured AP map found.
AP[0]: AHB-AP (IDR: Not set, ADDR: 0x00000000)
AP[0]: Skipped. Could not read CPUID register
Attach to CPU failed. Executing connect under reset.
Failed to power up DAP
CPU could not be halted
Reset: Core did not halt after reset, trying to disable WDT.
Reset: Halt core after reset via DEMCR.VC_CORERESET.
Reset: Reset device via reset pin
Reset: VC_CORERESET did not halt CPU. (Debug logic also reset by reset pin?).
Reset: Reconnecting and manually halting CPU.
Found SW-DP with ID 0x6BA02477
DPIDR: 0x6BA02477
CoreSight SoC-400 or earlier
AP map detection skipped. Manually configured AP map found.
AP[0]: AHB-AP (IDR: Not set, ADDR: 0x00000000)
AP[0]: Skipped. Could not read CPUID register
Attach to CPU failed. Executing connect under reset.
Failed to power up DAP
CPU could not be halted
CPU could not be halted
****** Error: Failed to halt CPU.
With a NORMAL reset, CPU halts and the whole memory erases:
J-Link>Reset
Reset delay: 0 ms

****** Error: Timeout while erasing sectors  @0x00FF8000, RAMCode did not respond in time!
Failed to erase sectors.

Reset type: NORMAL (https://kb.segger.com/J-Link_Reset_Strategies)
Reset: ARMv8M core with Security Extension enabled detected. Switch to secure domain.
Reset: Halt core after reset via DEMCR.VC_CORERESET.
Reset: Reset device via AIRCR.SYSRESETREQ.
J-Link>Go
Memory map 'after startup completion point' is active
J-Link>ishalted
CPU is halted (PC = 0xEFFFFFFE).
J-Link>mem32 0 8
00000000 = FFFFFFFF FFFFFFFF FFFFFFFF FFFFFFFF
00000010 = FFFFFFFF FFFFFFFF FFFFFFFF FFFFFFFF
6. Write APPROTECT.DISABLE = SwUnprotected
This is easily done with a secure build, since everything is trusted and all addresses can be written to. I simply add this snippet anywhere in my code and I can debug using `west debug` or Ozone debugger (even though step number 5, pin reset, fails).
#define APPROTECT_BASE      0x50039000
#define APPROTECT_DISABLE   (*(volatile uint32_t *)(APPROTECT_BASE + 0xE10))

#define APPROTECT_DISABLE_SwUnprotected 0x5A

void unlock_debug() {
    APPROTECT_DISABLE = APPROTECT_DISABLE_SwUnprotected;

    // Memory barrier
    __DSB();
    __ISB();
}
SYS_INIT(unlock_debug, APPLICATION, 0);
west build -p always -b nrf9151dk/nrf9151
With a non-secure build, only the base address is different.
#define APPROTECT_BASE 0x40039000
west build -p always -b nrf9151dk/nrf9151/ns
But in this scenario, the debugger fails to attach. Ozone shows this error: "The target stopped in BusFault exception state. Reason: Unknown at 0x0000998E." And the address points to ncs/v3.1.0/zephyr/soc/nordic/nrf91/soc.c:29,
static int nordicsemi_nrf91_init(void)
{
#ifdef CONFIG_NRF_ENABLE_ICACHE
    /* Enable the instruction cache */
    NRF_NVMC->ICACHECNF = NVMC_ICACHECNF_CACHEEN_Msk; <-------
#endif

    return 0;
}
which I suppose happens because the firmware tries to access forbidden addresses when doing `APPROTECT_DISABLE = APPROTECT_DISABLE_SwUnprotected` in `unlock_debug`. What is the correct approach for debugging firmware produced by a non-secure build for nRF9151?

