[Verification of RAMCode failed]

hi.

I am seeking your assistance regarding a J-Link (PLUS) debugging issue on a custom board featuring the PAN1770 module (ENW89854C1KF), which integrates the Nordic nRF52840 (ARM Cortex-M4F).

I have previously verified that debugging the PAN1770 on the evaluation board using the onboard J-Link debugger works without any issues.

USE

  • SEGGER Embedded Studio for ARM 7.32a
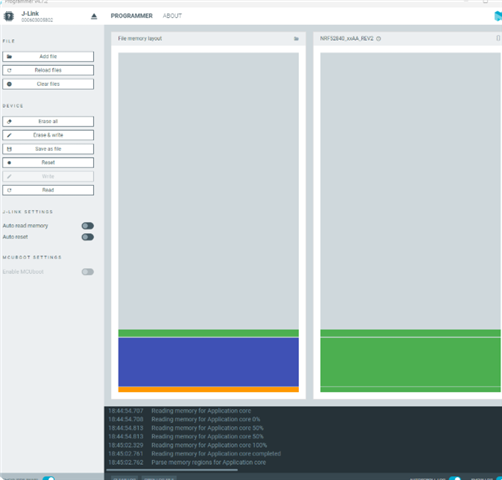
  • nRF Connect for Desktop - Programmer (v4.7.2)
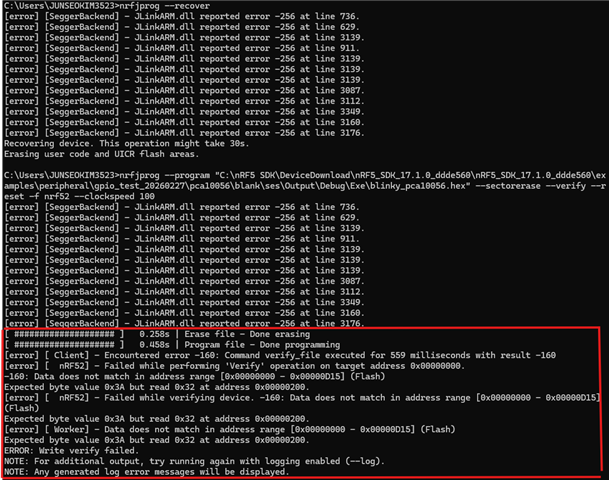
  • J-Link terminal, CMD

However, I am now attempting to debug on our custom-designed PCB featuring the same PAN1770 module, and I am encountering the following persistent errors.

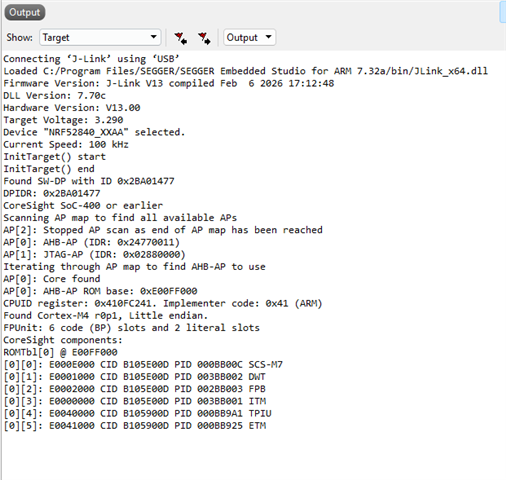
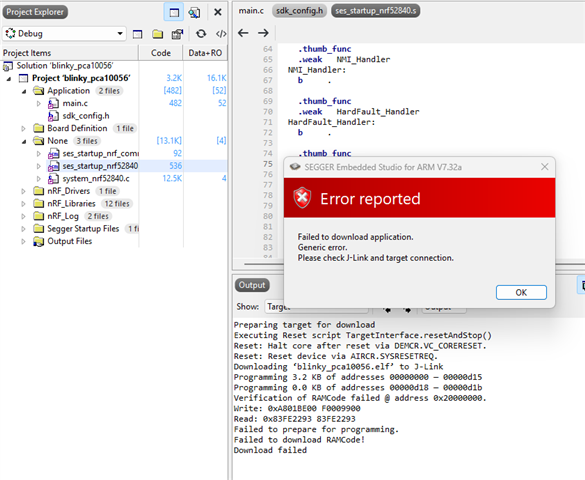
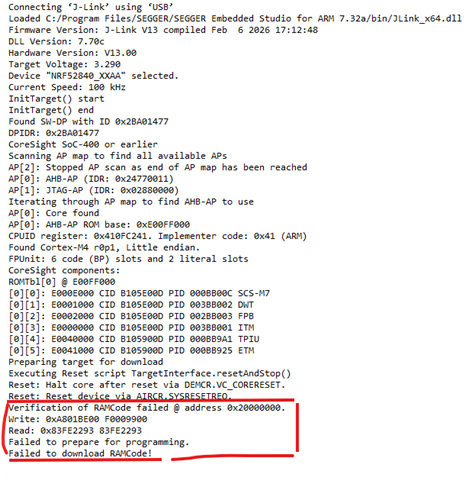
The SWD connection and basic communication seem to be established correctly; however, I am unable to write to the RAM region (0x20000000). I am unsure if there is a specific configuration or setting I am missing.

I am desperately seeking your expert guidance on the following issues, as I suspect there might be a fundamental configuration or hardware stability issue:

Why is the 'RAMCode' verification failing?

Why do the written and read data values differ (e.g., 0x3A vs 0x32)?

Why does access to the RAM region (0x20000000) consistently lead to a terminal freeze and Error -256?

What are the recommended debugging steps to resolve this?

"I am in desperate need of your expert guidance and would greatly appreciate your help in resolving this issue. Thank you very much for your time and support.”

  • Hi,


    Q1: Can you please try to issue "nrfjprog --recover" first, then re-flash?

    Q2: How many of your devices behave like this?

    Q3: Was this device previously working, and or has it always been non-working?

    Why do the written and read data values differ (e.g., 0x3A vs 0x32)?

    This is a verification error, ie. that the written vs. readback content differs.

    It is a similar scenario for the RAMCode error you are seeing.


    Kind regards,

    Håkon

    1. I’ve tried reflashing/resetting many times using nrfjprog --recover -f NRF52.

    2. The same PAN1770 module works normally on the vendor’s evaluation board, but on our custom boards (also using PAN1770) all of them show the same issue. We believe we have done sufficient hardware validation.

    3. Yesterday, one of our hardware engineers managed to get one board to successfully enter a debuggable/programmed state by trying various terminal commands, but unfortunately the exact steps were not recorded. We haven’t been able to reproduce it since, even after trying different combinations. That’s why I suspect there may be a specific sequence of commands or a tool-side setting that makes the difference.

    Current observation / difference between a “good” board and a “bad” board:
    When I use the nRF Connect for Desktop Programmer app and download the exact same HEX file,

    • On the “good” board, the Programmer app correctly recognizes and programs the image into separate regions such as Engine (SoftDevice), Application, and MBR or Application (three distinct sections).

    • On the “bad” boards, the same HEX seems to be treated as Application only and the memory map/regions do not get separated the same way, and the download/verify keeps failing.

    So it looks like the failing boards may not be handled with the same memory layout/region interpretation (SoftDevice/MBR/Application), which might be why programming and verification keeps failing.

  • Hi,


    Kjs0 said:
    The same PAN1770 module works normally on the vendor’s evaluation board

    Does this mean that you have done a swap-test, ie. took a module from a bad board, and mounted in on a known good board, and the failure does not follow the module?

    Meaning that the failure follows the PCB, not the nRF?


    If yes, could you share your schematic?

    Do you have a 32k source present, and do you have DCDC inductors present?


    Kind regards,

    Håkon

Related