
Hi folks,
I'm using v3.2.2 of the nRF Connect SDK Toolchain, debugging an nRF54LM20-DK board in VS Code.
I've noticed that the "Thread Viewer" under the NRF Debug view does not reliably show up. Sometimes it will show up if I click "Flash", followed by "Debug" (which appears to flash the image a second time). However, if I just I just hit the 'debug' button alone, the "Thread Viewer" doesn't show up.
If the "Thread Viewer" is visible, and I use the 'restart' debug button, the target will restart at main(), but the "Thread Viewer" will disappear.
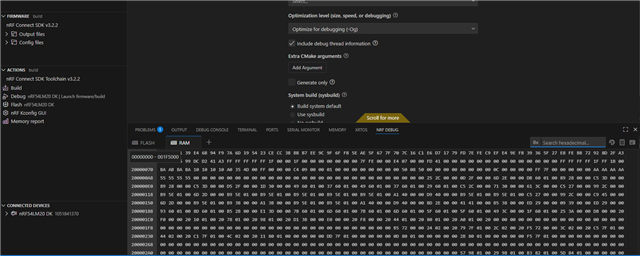
I have "Optimize for debugging" set as well as "Include debug thread information". There are no spaces in the path to my project.
Note that my issue is not an empty Thread Viewer as some other folks have commented on, but a totally missing Thread Viewer.
Other folks on my team have similar issues.
Here is a screenshot of the NRF Debug view.
Thoughts?
Dave J.

