Hi all,
During the Bluetooth connection process, there is a small probability of the following phenomena occurring (both of which are the same firmware, with the similarity being that I2C will read data every 50ms at this time. I don't know if this will have an impact). In each of these phenomena, there is an assert, but no log corresponding to the number of rows for the asset is seen (CONFIG_RESET_ON_FATAL_ERROR=n CONFIG_ASSERT=y). Do you have any suggestions for me to eliminate the following phenomena.
Error Phenomenon 1:
13> [00:08:29.757,840] <err> os: ***** HARD FAULT *****
13> [00:08:29.757,979] <err> os: Fault escalation (see below)
13> [00:08:29.758,123] <err> os: ARCH_EXCEPT with reason 4
13>
13> [00:08:29.758,272] <err> os: r0/a1: 0x00000004 r1/a2: 0x0000013b r2/a3: 0x00000026
13> [00:08:29.758,465] <err> os: r3/a4: 0x00000004 r12/ip: 0x00027961 r14/lr: 0x00056bd7
13> [00:08:29.758,651] <err> os: xpsr: 0x290000f5
13> [00:08:29.758,787] <err> os: Faulting instruction address (r15/pc): 0x0006b164
13> [00:08:29.758,963] <err> os: >>> ZEPHYR FATAL ERROR 4: Kernel panic on CPU 0
13> [00:08:29.759,129] <err> os: Fault during interrupt handling
13>
13> [00:08:29.759,271] <err> os: Current thread: 0x200053e0 (main)
13> [00:08:29.759,417] [1;31m<err> os: Halting system[0m
Note:
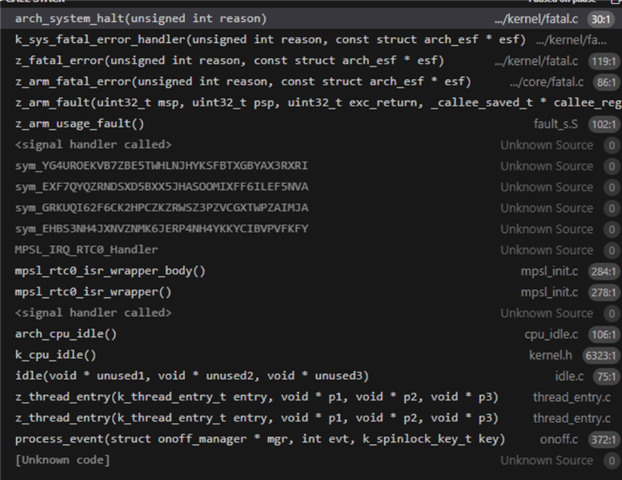
addr2line -e zephyr.elf -f 0x0006b164
assert_post_action
zephyr/lib/os/assert.c:44
addr2line -e zephyr.elf -f 0x00056bd7
sdc_assertion_handler
nrf/subsys/bluetooth/controller/hci_driver.c:315
Error Phenomenon 2:
13> [00:03:55.820,388] <err> os: ***** HARD FAULT *****
13> [00:03:55.820,527] <err> os: Fault escalation (see below)
13> [00:03:55.820,671] <err> os: ARCH_EXCEPT with reason 4
13>
13> [00:03:55.820,820] <err> os: r0/a1: 0x00000004 r1/a2: 0x00000133 r2/a3: 0x00000015
13> [00:03:55.821,014] <err> os: r3/a4: 0x00000004 r12/ip: 0x007072a0 r14/lr: 0x0005785f
13> [00:03:55.821,202] <err> os: xpsr: 0x210000f5
13> [00:03:55.821,339] <err> os: Faulting instruction address (r15/pc): 0x0006b164
13> [00:03:55.821,519] <err> os: >>> ZEPHYR FATAL ERROR 4: Kernel panic on CPU 0
13> [00:03:55.821,695] <err> os: Fault during interrupt handling
13>
13> [00:03:55.821,846] <err> os: Current thread: 0x20005318 (idle)
13> [00:03:55.822,000] [1;31m<err> os: Halting system[0m
Note:
addr2line -e zephyr.elf -f 0x0006b164
assert_post_action
zephyr/lib/os/assert.c:44
addr2line -e zephyr.elf -f 0x0005785f
m_assert_handler
nrf/subsys/mpsl/init/mpsl_init.c:307
V3.1.0,NRF54L15
Looking forward to your reply!