
I'm debugging on an nRF52832 (nRF52-DK, non-preview) using the ARM GCC toolchain and GDB under Eclipse on Ubuntu 14.04LTS, set up following the devzone tutorial.
At various points, the processor jumps to the HardFault_Handler when plain-vanilla function calls push values to the call stack. Following instruction stepping the push, execution seems to run to the end of the address space. For example:
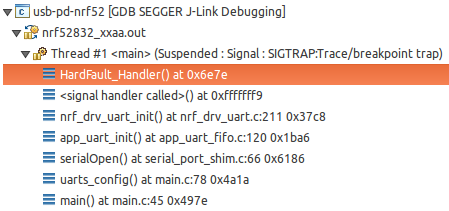
The HardFault occurs on the push instruction, during instruction stepping:
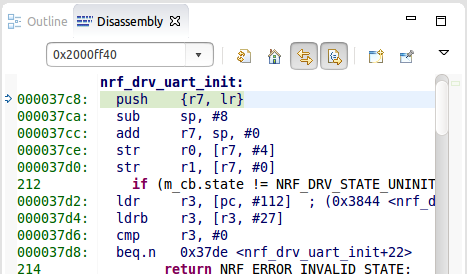
From build to build, with small changes, the specific function whose push instruction causes the HardFault varies, but it always occurs on the stack push.
Frustratingly, the issue doesn't seem "reversible" (all builds clean by default):
- Build, debug, run, hit HardFault_Handler on call to X()
- Make a small change in main - set a variable differently, etc.
- Build, debug, run, hit HardFault_Handler on call to completely different function in different compilation unit
- Undo the small change in main
- Build, debug, run, now function call to X() goes just fine, rest of code runs normally
I check the SP each time and never find it farther than 80-100 bytes from __StackTop, and the stack length is set to 8K. Given the unpredictability of the fault-inducing instruction's location, it "feels" like a word alignment issue or some compiler switch that isn't set correctly. The LR values in each push instruction pass sanity-check (they're within the .text section of FLASH and generally within a few bytes of the location of the original function call).
How can I determine a root cause for these HardFault exceptions that occur on seemingly-innocuous plain-vanilla function call stack pushes, at random? It's very hard to trust the toolchain when an issue like this isn't repeatable or reversible.

