This post is older than 2 years and might not be relevant anymore
More Info: Consider searching for newer posts

nRF51822 beacon kit: big notches in RSSI vs distance plot

Hello everybody,

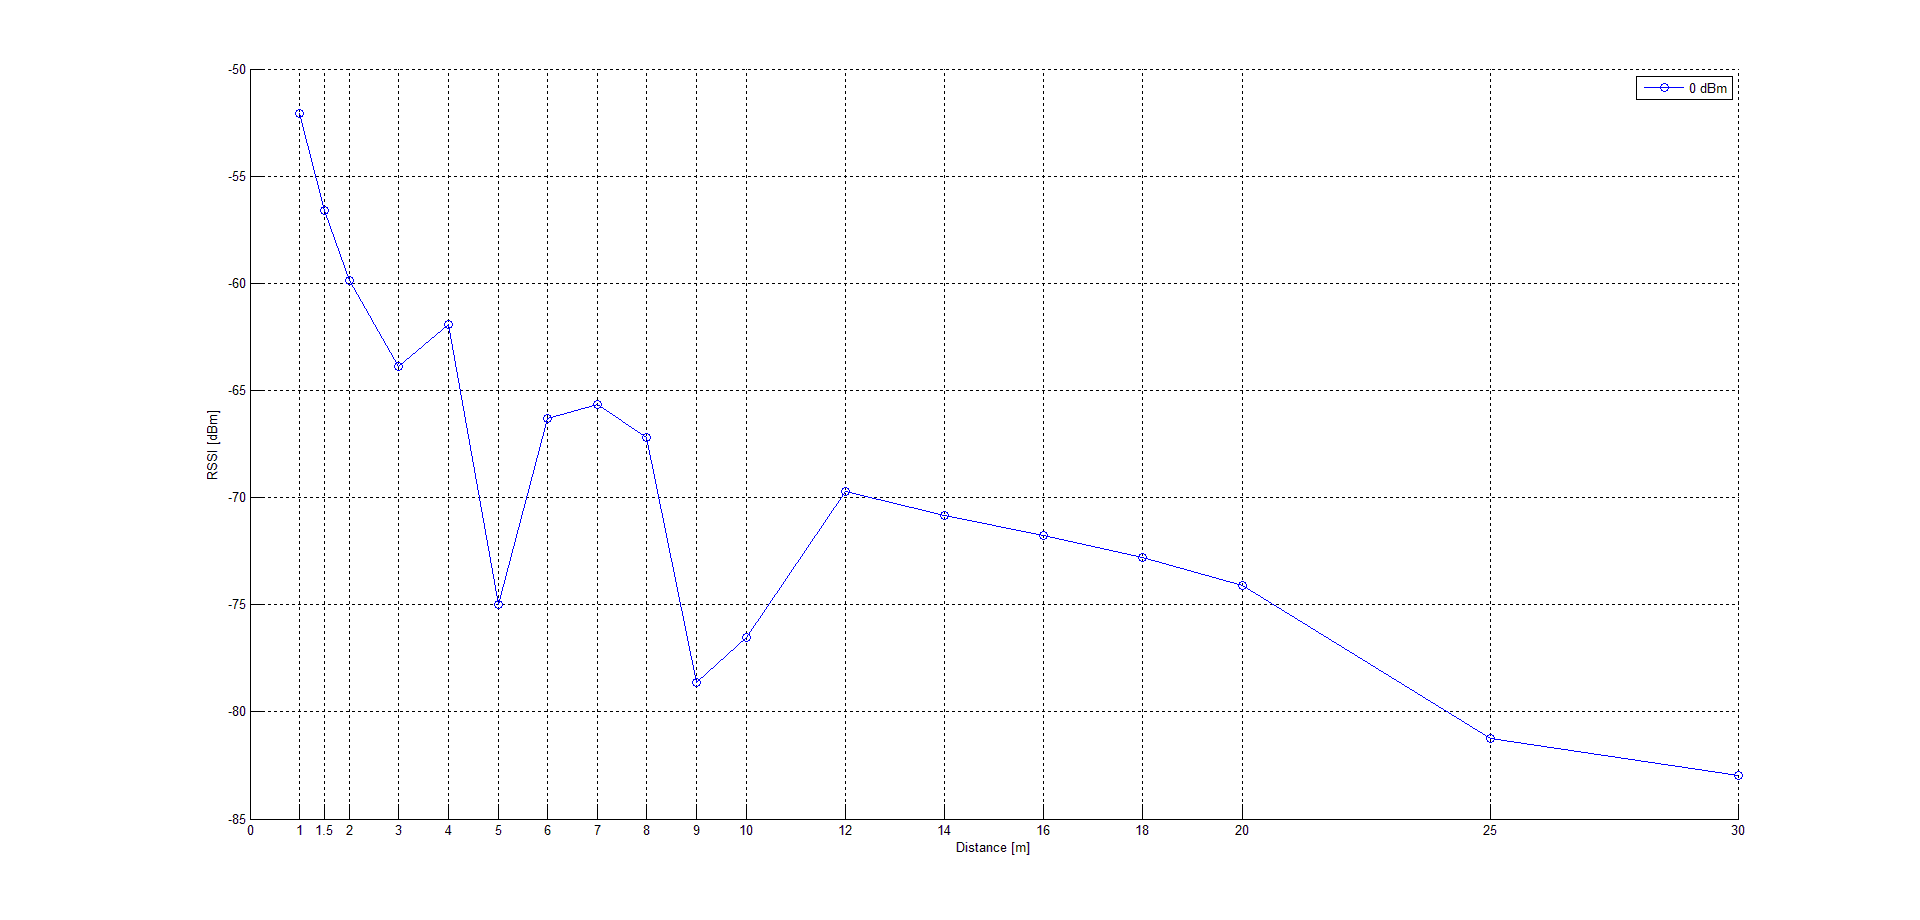
I'm designing an app to track the position of the smartphone using six beacons and, in order to do that, I made some measures both indoors and outdoors and plotted a graph of RSSI vs distance using the data acquired from nRF Connect app (exported to .csv and fed to Matlab). The first set of measures was taken in a corridor about 3m wide and 35m long at different transmission power level, the second set was taken outdoors in an open field about 30x25 m at 0 dBm transmission power. Both the plots show serious notches, as you can see from the pictures, causing great troubles with the accuracy of the tracking.

I'd like to know if this behaviour is to be expected or there is something wrong in the setup of the measures.

Thanks.
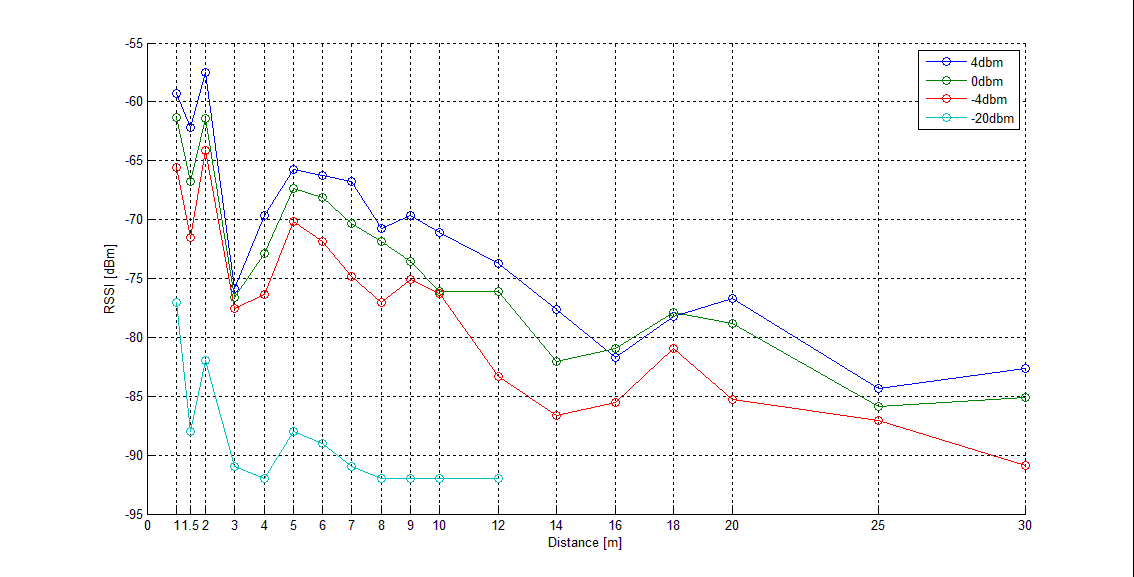
image description image description

  • Very interesting data.

    I suspect the dips and peaks in the RSSI may be caused by reflections.

    When measuring outdoors, what height did you have the beacon?

    Did you try varying the height of both the beacon and the receiver ( phone )

    In general RSSI is not a reliable indication of distance, as there are loads of different factors that will effect RSSI, not just distance. Including orientation of the antenna in both the Tx and Rx devices, as well as reflections off various types of surfaces at various amplitudes, and absorption of walls and any other material between the Tx and Rx.

  • Hi, thanks for your reply.

    Both the beacon and smartphone were placed on a stand about 0.80 m high. Unfortunately it didn't come to mind that measuring at different heights would be useful. I guess I could try that.

    I know measuring distance using RSSI might be far fetched (in fact, I posted another question regarding the radiation pattern of the beacon to try and rule that out), but that's what I'm asked to do in my project and anyway it's not supposed to be super-accurate, it's more like a demostration.

    Thanks again.

  • Is this raw RSSI data? If you plan to do anything useful with the RSSI you need to apply some filtering methods to avoid notches due to reflections, multi-paths, etc

  • Hi Classicman,

    As Roger and Daniel pointed out, scalar RSSI is pretty much unusable for distance measurement in real environment unless you will start to do thing such as correlation of measurements at multiple points, filtering, fingerprinting of particular topology (= calibration of your algorithms to known properties of given room/corridor/building) etc. You can find many questions and answers which are pointing to this known property of 2.4GHz radio on this forum.

    You can still use RSSI as "rough" indication of relative distance or movement direction but you need to understand that even thing like "I have now mobile phone in back pocket of my jeans" can change the value by 10 or 20dBm and you can only guess if the source suddenly moved 10 meters away or if some shielding/reflection happened.

    Cheers Jan

  • Thank you both for your replies.

    While the data is not raw since the nRF Connect app itself plots the average value of the RSSI over different packets received, I do agree that more sophisticated filtering along with additional information might be of great help to calculate the position of the smartphone.

    I guess I still need to figure out how to proceed.

    But first, since I was asked for a notch-free plot, I'd like to remove those. Do you think the graph could benefit from taking measures in an open field (like, an actual field, completely free of obstacles in every direction) or the reflections of the ground will always be a problem, and I should focus my efforts towards the filtering only?

    Thank you all again.

Related