Hi,
I was trying to plot incoming ADC variables using Keil Logic Analyzer function inside the IDE.
So far no success; I am able to use it when using STM32 board.
Is this function supported by nRF52832 ?
Thanks.
Lee
Hi,
I was trying to plot incoming ADC variables using Keil Logic Analyzer function inside the IDE.
So far no success; I am able to use it when using STM32 board.
Is this function supported by nRF52832 ?
Thanks.
Lee
Hi,
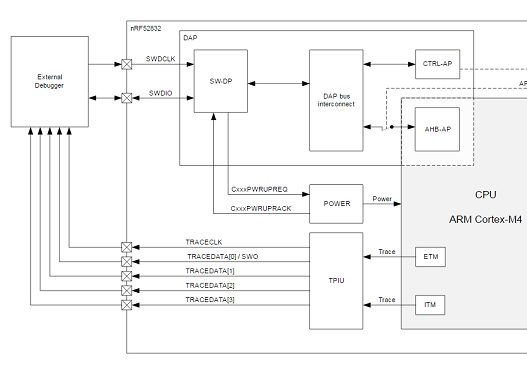
Keil Logic Analyzer uses Trace to interface with a target MCU. On the nRF52832 there is a Trace Port Interface Unit(TPIU) you can use to connect to an external debugger that supports trace, in order to use Keil Logic Analyzer. Note that debuggers with trace-functionality tend to cost quite a bit more than ones without this feature.
There is also a blog post here about using Trace with the nRF52832 you can read.
Figure showing the TPIU port:

Earlier I was using STM32F4 discovery board; and I find the Logic Analyzer to be quite useful to do a quick check on the incoming data(mostly from variety of sensors); so I get used to relying on it. When I was trying to do the same in nRF52, I can't seem to see the plot; I can see, once in a while, a data point listed in the graph; so wondering if my setup is not correct ? I am using Segger J-Link Plus as my SWI/JTAG probe; so it does not come with an enhanced TRACE.
I was under the impression that some of this debug is part of ARM Cortex-M4 core standard; so user can use a "simpler" tool as lots of debugging cores are built in to the M4 processor itself.
At the moment, yes, I am using NRF_LOG_INFO to stream out the data thru the Segger RTT log windows; this works but requires a little bit more work than if I have the logic analyzer function.
Thanks for all the comment though.
Lee