
I have to evaluate the results obtained for time synchronization in a piconet BTLE through the use of the RBS protocol. For this purpose I use a nRF52 DK as beacons to transmit not connectable advertising packets every second. Two nRF52 DK nodes, which implement different BTLE services and have the S130 softdevice activated, record the time of reception of the beacon and share this information. In this way they are able to construct a map of their relative offset. In this nodes I use TIMER1 to identify the instant of reception of the beacon. This the code for the timer:
void start_timer(void)
{
NRF_TIMER1->MODE = TIMER_MODE_MODE_Timer;

NRF_TIMER1->TASKS_CLEAR = 1;

NRF_TIMER1->PRESCALER = 2;

NRF_TIMER1->BITMODE = TIMER_BITMODE_BITMODE_32Bit;

NRF_TIMER1->CC[0] = 0;

NRF_TIMER1->TASKS_START = 1;
}
uint32_t capture_timer_value(void)
{
uint32_t captured_value;

NRF_TIMER1->TASKS_CAPTURE[0] = 1;

captured_value = NRF_TIMER1->CC[0];
// NRF_TIMER1->TASKS_CLEAR = 1;
return captured_value;
}
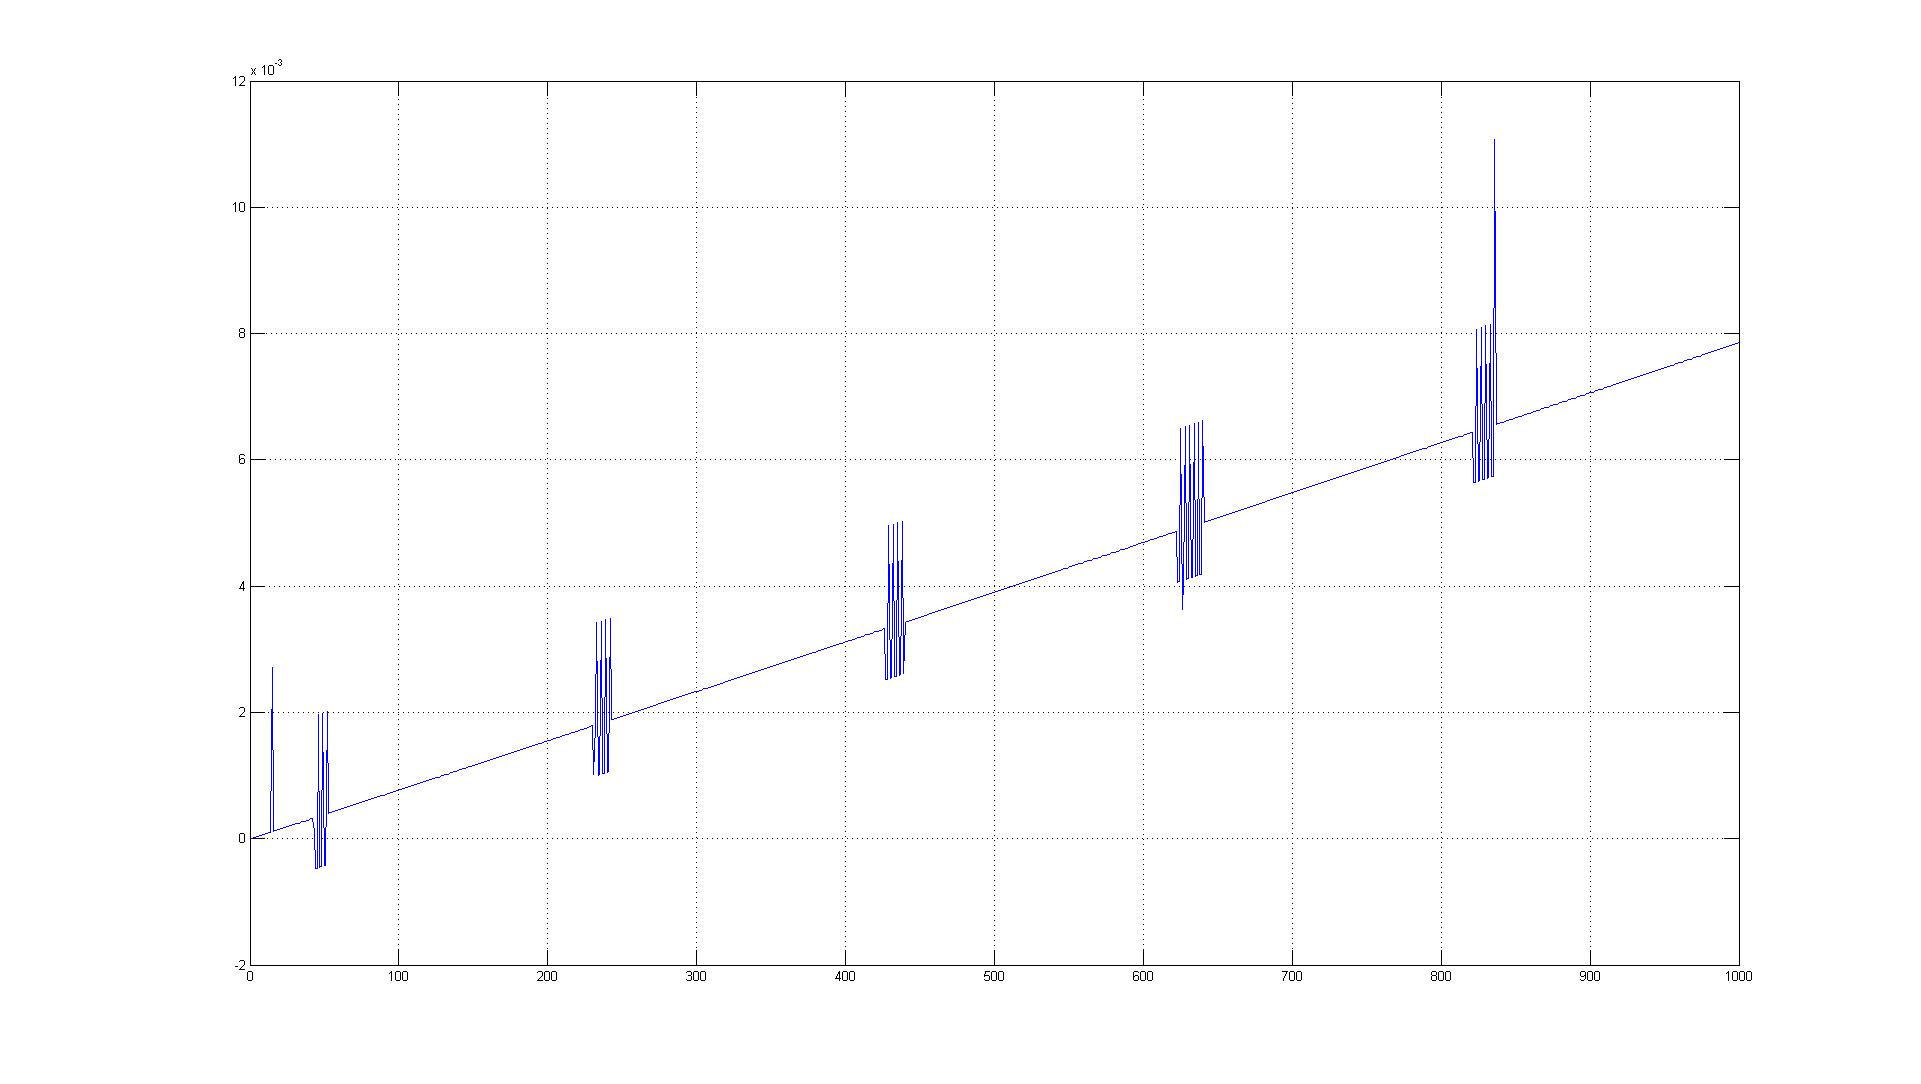
When the beacon is received, is called the capture_timer_value() function to capture the timer value. What happens is that the trend of the differences between the times of reception of the beacon relative to the two nodes has a correct average trend, but presents abnormal periodic oscillations. What the cause of this oscillations? Can anyone help me?
Tanks.
