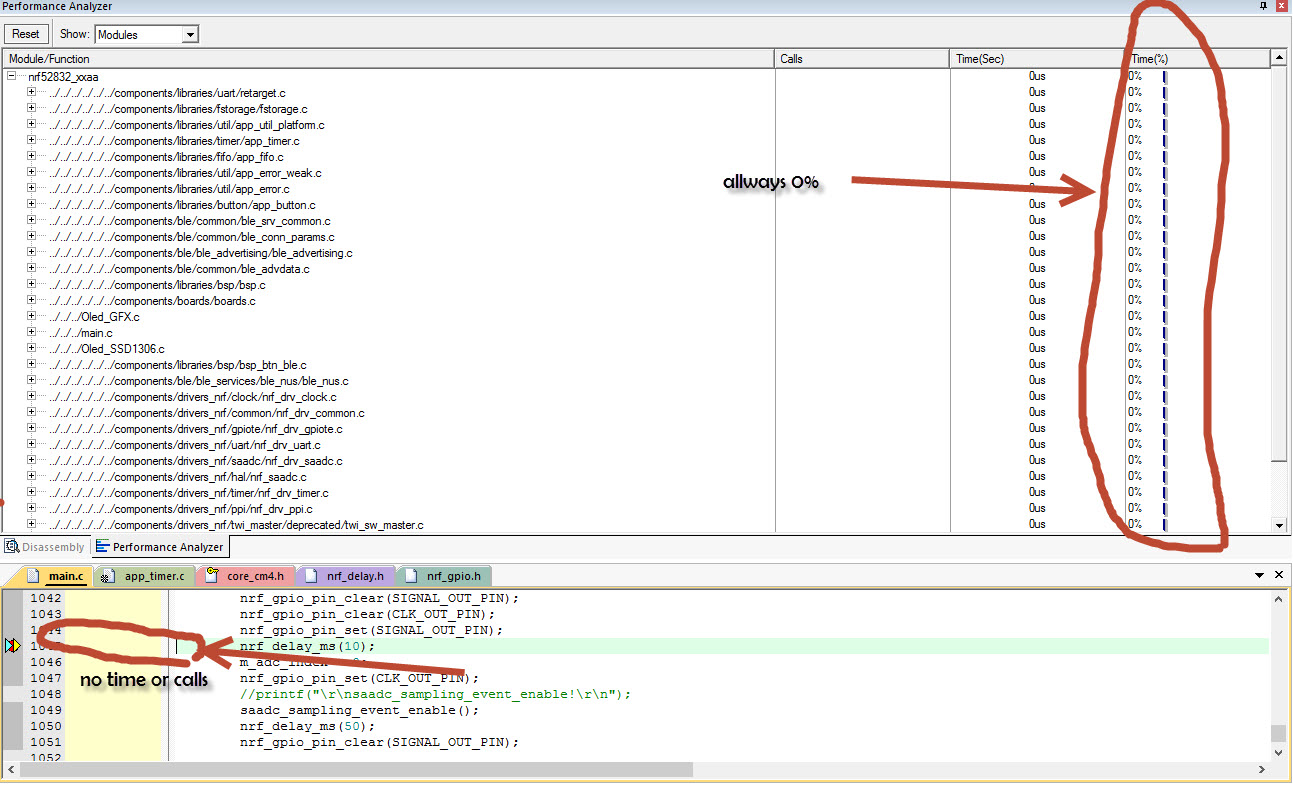
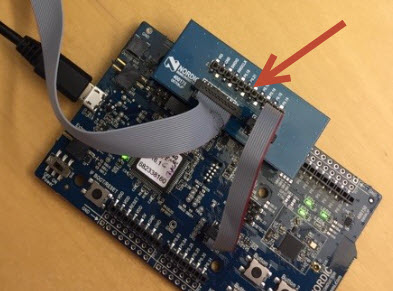
How i can see the performance like the Picture. is allways 0% and had also no time or calls in the execution profile. Breakpoints works. But when i press F10 (Step over) will the compiler allways reset and jump to the first breakpoint. I work wit ULINKpro and NRF52DK (10 wire plug)