This post is older than 2 years and might not be relevant anymore
More Info: Consider searching for newer posts

Call stack window does not display local values

I'm running a debug session.

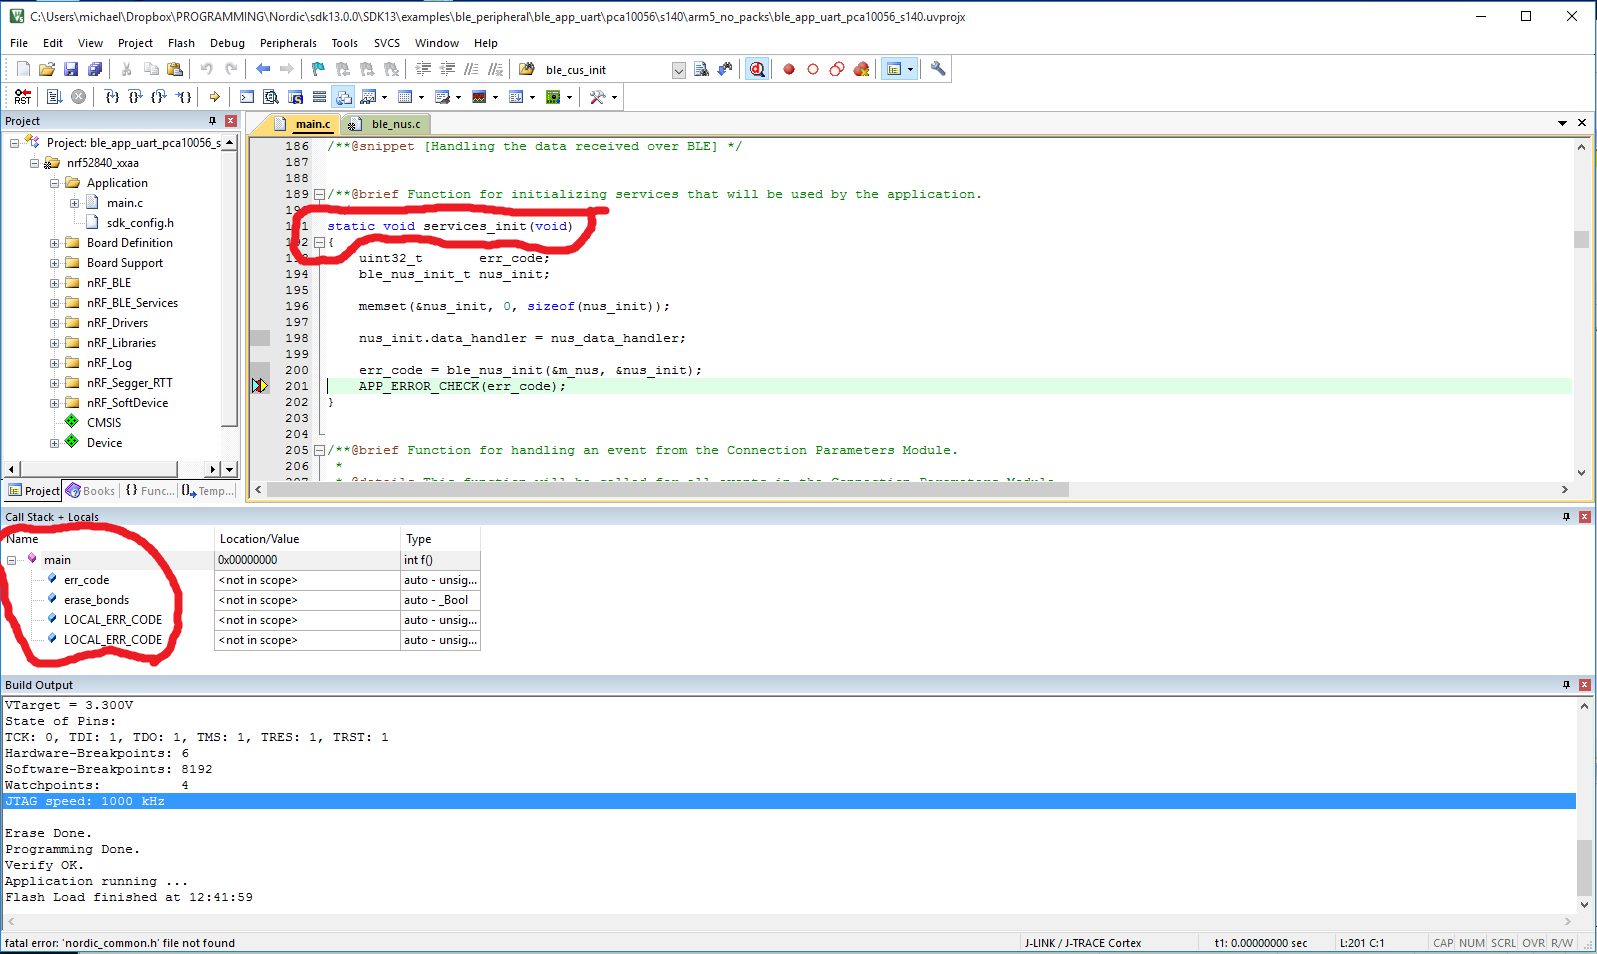
I set a break point inside of function services_init on line 201.

I ran the run up to break point command

image description

The processor pauses on line 201 as expected. However, the stack window only displays variables local to the main function.

Why don't I see the variables local to services_init?

image description

Parents
  • Hi,

    Try going into project settings -> C/C++ tab, and set optimization level to -O0. Then re-compile and flash the firmware again. When enabling higher optimization, the compiler looks for patterns in your all of your code, squishes similar sections together, and the outcome is not as streamlined as your source code. This is the reason why debugging with high optimization may give inconsistent "jumps" in code, and the call stack may not show all variables correctly.

    Cheers, Håkon

Reply
  • Hi,

    Try going into project settings -> C/C++ tab, and set optimization level to -O0. Then re-compile and flash the firmware again. When enabling higher optimization, the compiler looks for patterns in your all of your code, squishes similar sections together, and the outcome is not as streamlined as your source code. This is the reason why debugging with high optimization may give inconsistent "jumps" in code, and the call stack may not show all variables correctly.

    Cheers, Håkon

Children
Related