I'm using and NRF52 with S132 and SDK13.0. I'm using Keil as my IDE.
My application acts as a central for smart phones to connect to and also acts as a peripheral to conect to multiple other devices.
Currently my app works well with up to 2 smart phones configured and connected, and up to 4 of the external devices connected simultaneously.
I am currently trying to add the capability for more smart phones to connect to my device. Unfortunately, when I configure my device to be able to connect to more than 2 smart phones, it starts receiving usage faults. My knowledge of debugging this is somewhat limited so, the method i use and conclusion I've drawn may be wrong. I'd love some help to figure it out.
I've been using this app note to help me.
The image below shows the registers, fault reports, and location (i believe this is correct) of the
fault.
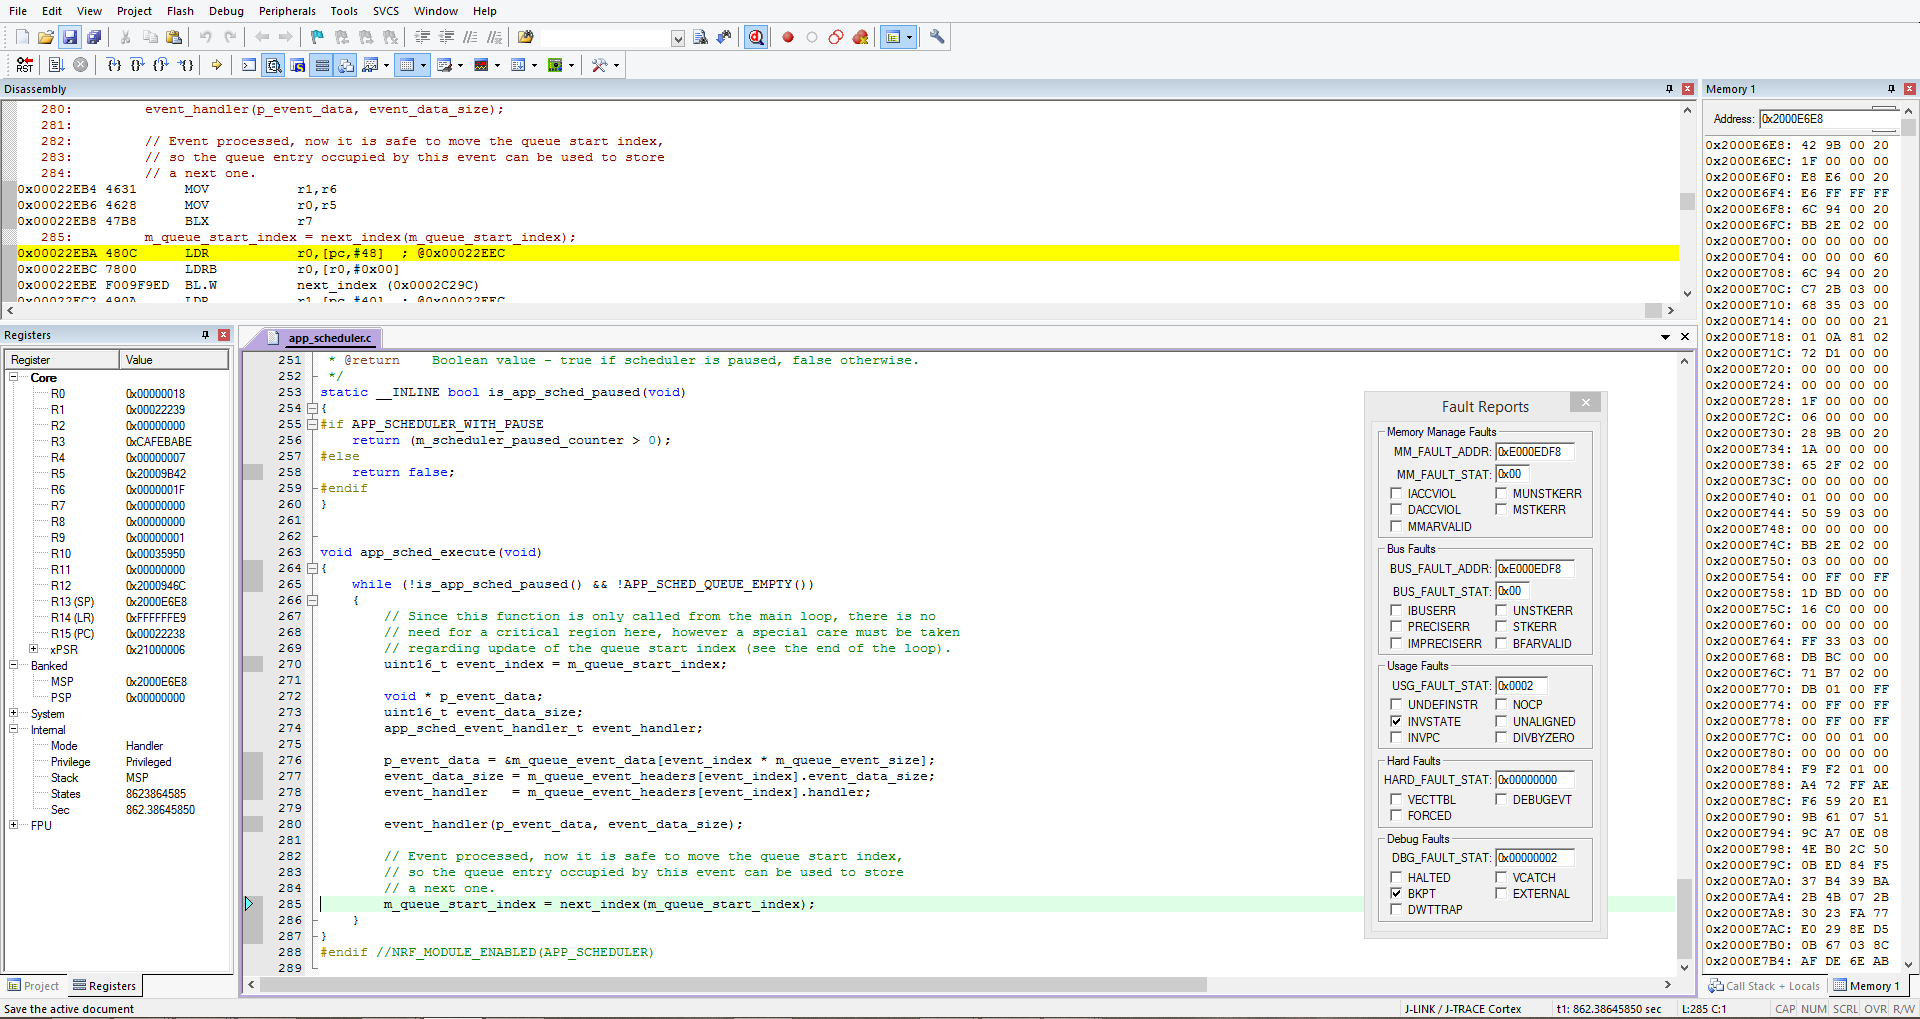
here's my process for coming to that point
- Link Register is 0xFFFFFFE9, bit 2 is zero so, The main statck is used.
- The main stack pointer (MSP) points to 0x2000E6E8
- So looking at the contents of memory at 0x2000E6E8, I can see the previous execution context
- The Link register of the previous execution context is 0x022EBB, minus 1 because it is in thumb mode, gives 0x022EBA. This shows where the code is returning to and this is shown in the disassembly window as m_queue_start_index = next_index(m_queue_start_index); So think it's coming back from event_handler(p_event_data, event_data_size);
- The Fault Report window shows it is a usage fault with INVSTATE set which means
the processor has attempted to execute an instruction that makes illegal use of the Execution Program Status Register (EPSR). When this bit is set, the PC value stacked for the exception return points to the instruction that attempted the illegal use of the EPSR. Potential reasons: a) Loading a branch target address to PC with LSB=0. b) Stacked PSR corrupted during exception or interrupt handling. c) Vector table contains a vector address with LSB=0.
So I think that the error is happening in event_handler(p_event_data, event_data_size) in app_scheduler.c but, when I put some debug statements around my app_scheduler event statement, i always see it start and finish. I've also check my appsceduler queue usage using app_sched_queue_utilization_get but never see more than a 40% utilisation
It may not be related, but I'm also occasionally seeing a busfault with IBUSSERR set and I get the same LR value of the previous execution context which is 0x022EBB, minus 1 because it is in thumb mode, gives 0x022EBA.
instruction bus error. The processor detects the instruction bus error on prefetching an instruction, but it sets the IBUSERR flag to 1 only if it attempts to issue the faulting instruction. When the processor sets this bit it does not write a fault address to SCB->BFAR. Potential reasons: a) Branch to invalid memory regions for example caused by incorrect function pointers. b) Invalid return due to corrupted stack pointer or stack content. c) Incorrect entry in the exception vector table.
How can I debug this further. Also, what does the 0xCAFEBABE in R3 of the registers window mean? I doubt this is just some random address
Edit 01 Aug for Clarification The issue manifests itself in the following way:
- Connect Smart phones and external device to my device.
- Let the devices run. The external devices generate data at a rate of 25Hz. In my event handler for the notification , I notify the smartphones with the new data and add an app scheduler event to the queue to log the received data.
- Eventually (after a few minutes), I get a Bus Fault or usage fault. This happens sometime between finishing processing an app scheduler event and processing the next one in the queue. It does not happen in my BLE service event handlers. I have not seen any issues when there is not another app scheduler event to process.
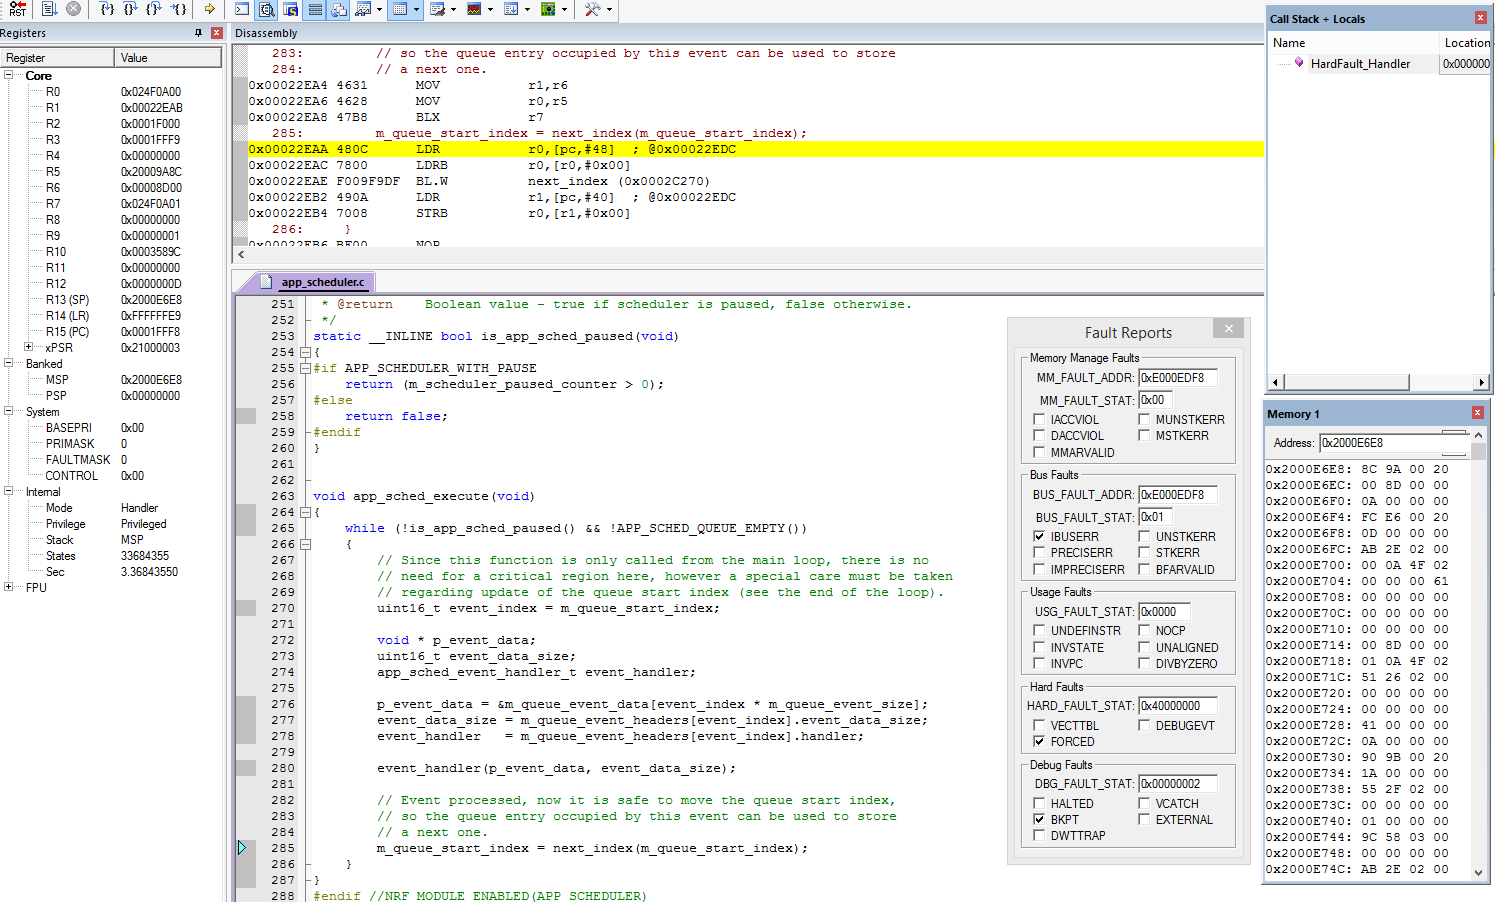
If I don't enable the Bus Fault and Usage fault handlers then The code goes into the hard fault handler.
If I look at the call stack when in the hardfault handler, there is no information. The image below shows the register values from the hardfault handler with the bus fault and usage fault handlers turned off (in this case it looks like I got a bus fault).