
Gentle folks,
I'm sure I'm making some simple, primitive error. Please help me mend my ways :-)
Using gcc in the NetBeans IDE on MacOS for building and running the ble_app_hrs sample app and SoftDevice S132 with a nRF52-DK (PCA10040, V 0.9.0, 2015.41) as target. Builds and runs fine (including connecting and handling BLE requests from an iPhone BLE monitor app).
But when I attempt to run in debug mode from the IDE (after starting JLinkGDBServer (JLinkARM.dll V6.16 (DLL compiled Jun 2 2017 17:59:14)), setting a breakpoint at the first executable line in main(), and connecting to the debugger, the app fails immediately (before ever reaching the breakpoint in main) with a soft device fault.
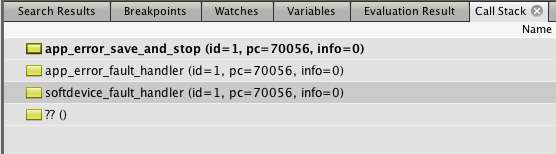
Note: Fails ==> Loops forever in the app_error_save_and_stop function. If I pause the app, then I can examine variables in that function. Therefore, I conclude that gdb is properly in control and has properly loaded the symbol table.
Here's the stack backtrace:
Any hints on what's wrong and how to fix this?
TIA,
Mike
PS: The nRF52-DK currently shows up on the USB as a Flash device named "JLINK".
PPS: Chasing down the interpretation of constants like Soft Device fault IDs is a pain in the online docs, hop-scotching through macro definitions. Sure would be nice if the values were collected in a table. Or am I missing something?
