This post is older than 2 years and might not be relevant anymore
More Info: Consider searching for newer posts

central stops receiving after sometime

Hi,

Central: nrf52840

peripheral: nrf52840

Connection interval (both min & max) = 10ms

ATT_MTU size: 52 bytes

Dle: 52+4 bytes

Connection event extension: enabled

Slave latency: 0

Connection supervision timeout: 4s

PHY: 1MBps

softdevice: 140

I'm transmitting 10 samples wrapped to 48 bytes as notification and hence set the ATT_MTU size to 52 bytes considering the overhead for notification to 3 bytes + 1 extra safe side. The issue is suddenly after 30 mins there is a disconnection and I get to see only EMPTY DATA PDU through nrf sniffer. However, I didn't notice anything as Connection Disconnection timeout or so. It's just after the last notification, I get to see only EMPTY DATA PDU and no samples at the UART(which is logged at the central) This is for a medical application. So I need to maintain this throughput with very low/0 latency and no potential disconnection. Your valuable suggestions will help me fix the problem.
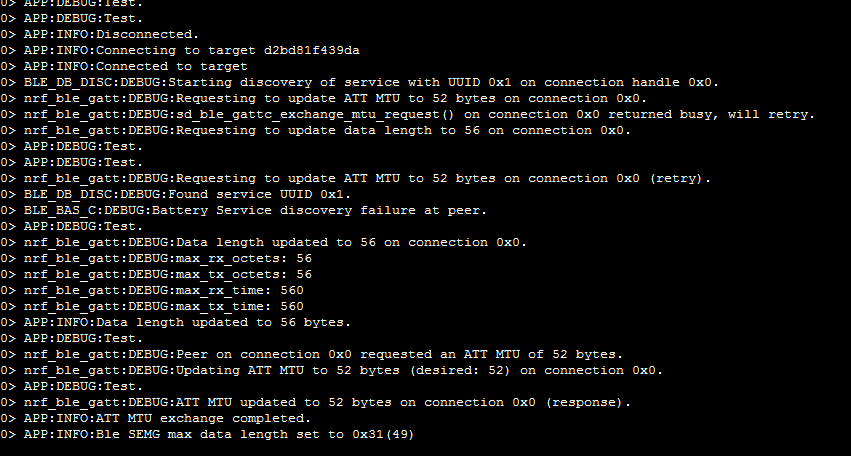
J Link viewer logs

LOG

Thanks, Nivetha

Parents
  • What we think has happened is that your application has written to protected memory. And the nRF52 HW has generated an interrupt that the SoftDevice has forwarded to you with the app_error_fault_handler function. So, if you have a breakpoint set there, the offending instruction in your application should be able to be spotted by looking at the callstack. What are you using for debugging? Keil? GDB?

Reply
  • What we think has happened is that your application has written to protected memory. And the nRF52 HW has generated an interrupt that the SoftDevice has forwarded to you with the app_error_fault_handler function. So, if you have a breakpoint set there, the offending instruction in your application should be able to be spotted by looking at the callstack. What are you using for debugging? Keil? GDB?

Children
No Data
Related