This post is older than 2 years and might not be relevant anymore
More Info: Consider searching for newer posts

read back protection puts tag to high current consumption

Hi, I am seeing an issue where after enabling read back protection (rbp) on NRF52 and using sdk 12.1 the tag goes to state where it drains a lot of current.

command used: nrfjprog -f NRF52 --rbp ALL

I have used power profiler to check the behavior, current drain jumps to about ~1.5 mA, from ~120 uA. Since nrfjprog commands are disabled after rbp, issuing a reset command (nrfjprog -f NRF52 --reset) would not help the issue, rather increases the current consumption even higher to about ~3.5 mA (although I see an error message indicating recover command should be used to talk to the chip again, but still the command seems to succeed the first time around and increase current drain even more):

$ nrfjprog -f NRF52 --reset ERROR: The operation attempted is unavailable due to readback protection in ERROR: your device. Please use --recover to unlock the device.

The only way to recover is via a battery pull (pinreset, or debugreset commands also do not seem to fix the issue as the current drain stays high).

Can you please help explain why (and also under what conditions) the chip goes to this state (probably "debug state"?) and how can I recover without a battery pull. I would need to have the rbp enabled and it seems using rbp is only one way the chip could get into this high current drain mode.

**Please help explain other possible conditions that could lead to this high current drain mode.

Thanks.
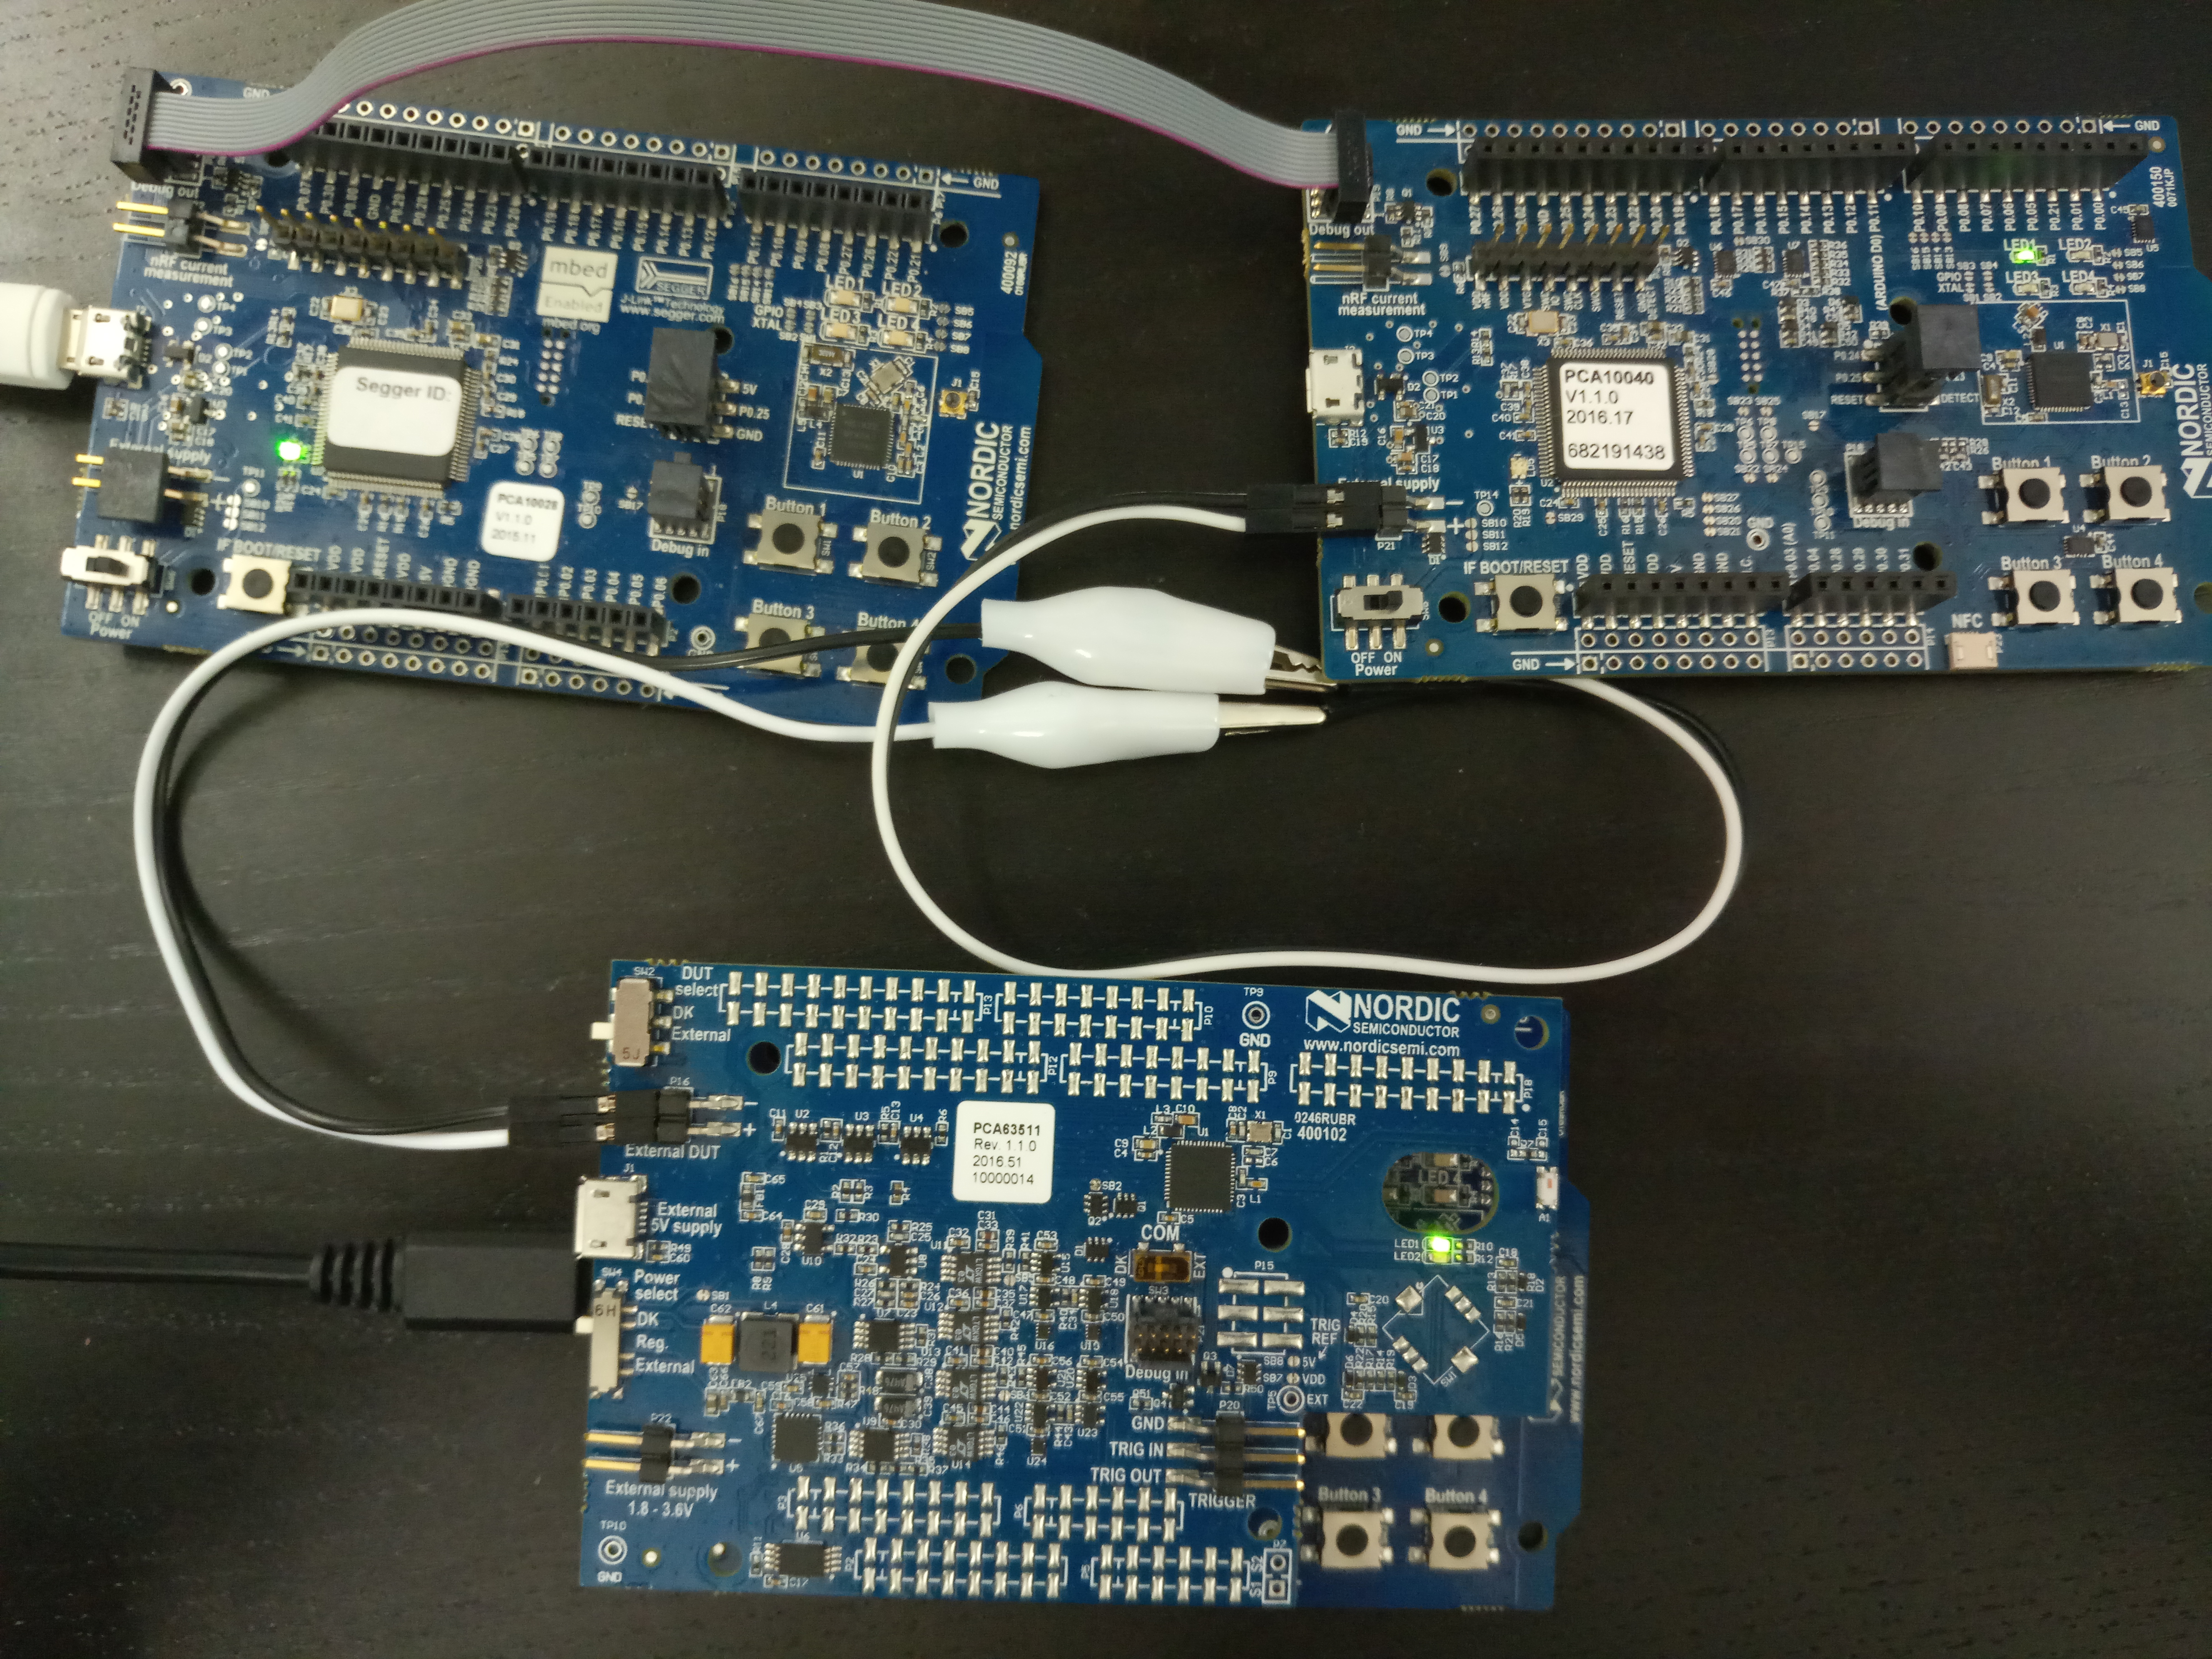
ppk setup

Parents
  • Yes, the chip enters debug mode, and needs to be reset. You can reset by using a pin reset: infocenter.nordicsemi.com/.../power.html. The PSELRESET registers need to be set, and the p21 pin must be routed out to the debugger. You can do a pin reset with nrfjprog --pinreset

    1. Yes, for debugging I use JLinkExe and connect to target via SWD interface and default speed (4000 kHz), and on the power prfiler I see the current drain goes high (~4ma) this is expected. Also on terminating the JLinkExe or simply disconnecting the ribbon cable I am able to exit and see the current drain goes back to normal.

    However, for programming the chip and enabling the RBP I use nrfjprog tool, this should not enable debugging. Please confirm.

    1. Unfortunately I am not able to modify the target to test the setup.

    There seems to be an issue with different combinations of nrfjprog and Jlink that would not issue a soft reset to exit debug mode. I think this revision works okay:

    $ nrfjprog -v nrfjprog version: 9.3.1 JLinkARM.dll version: 6.18a

    After programming the chip via commands below the reset work okay and current drain goes down:

    $ nrfjprog -f NRF52 --program ./merged.hex --verify --chiperase --reset

    **But the --reset doesn't seem to work on this older rev combination for example: $ nrfjprog -v nrfjprog version: 8.5.0 JLinkARM.dll version: 6.12a

    (this is maybe the issue you are experiencing)

    **3) Please try these commands on your setup (you should see similar issue as I am experiencing):

    -program the kit and monitor with ppk at the same time (use a different debug kit for this as there seems to be an issue where the same debug kit can not be used to program and run ppk):

    $ nrfjprog -f NRF52 --program ./merged.hex --verify --chiperase --reset

    -enable rbp: $ nrfjprog -f NRF52 --rbp ALL

    (the chip should go to "sleep" with high current drain)

    -try the same command above again or force a "reset":

    $ nrfjprog -f NRF52 --reset ERROR: The operation attempted is unavailable due to readback protection in ERROR: your device. Please use --recover to unlock the device.

    (You should see higher current drain but wakes up the chip)

    Now launching the debugger (JLinkExe) and trying the command you mentioned as below would not still work as the chip is locked. The chip would go back to sleep with even higher current drain. Logs below:

    $ JLinkExe SEGGER J-Link Commander V6.18a (Compiled Aug 11 2017 17:53:58) DLL version V6.18a, compiled Aug 11 2017 17:53:53

    Connecting to J-Link via USB...O.K. Firmware: J-Link OB-SAM3U128-V2-NordicSemi compiled Jul 24 2017 17:30:12 Hardware version: V1.00 S/N: 681691590 VTref = 3.300V

    Type "connect" to establish a target connection, '?' for help J-Link>connect Please specify device / core. : NRF52832_XXAA Type '?' for selection dialog Device> Please specify target interface: J) JTAG (Default) S) SWD TIF>S Specify target interface speed [kHz]. : 4000 kHz Speed> Device "NRF52832_XXAA" selected.

    Connecting to target via SWD Found SW-DP with ID 0x2BA01477 CTRL-AP indicates that the device is secured. For debugger connection the device needs to be unsecured. Note: Unsecuring will trigger a mass erase of the internal flash. Device will be unsecured now. Found SW-DP with ID 0x2BA01477 Scanning AP map to find all available APs AP[2]: Stopped AP scan as end of AP map has been reached AP[0]: AHB-AP (IDR: 0x24770011) AP[1]: JTAG-AP (IDR: 0x02880000) Iterating through AP map to find AHB-AP to use AP[0]: Core found AP[0]: AHB-AP ROM base: 0xE00FF000 CPUID register: 0x410FC241. Implementer code: 0x41 (ARM) Found Cortex-M4 r0p1, Little endian. FPUnit: 6 code (BP) slots and 2 literal slots CoreSight components: ROMTbl[0] @ E00FF000 ROMTbl[0][0]: E000E000, CID: B105E00D, PID: 000BB00C SCS ROMTbl[0][1]: E0001000, CID: B105E00D, PID: 003BB002 DWT ROMTbl[0][2]: E0002000, CID: B105E00D, PID: 002BB003 FPB ROMTbl[0][3]: E0000000, CID: B105E00D, PID: 003BB001 ITM ROMTbl[0][4]: E0040000, CID: B105900D, PID: 000BB9A1 TPIU ROMTbl[0][5]: E0041000, CID: B105900D, PID: 000BB925 ETM Cortex-M4 identified. J-Link>SWDSelect Select SWD by sending SWD switching sequence. Found SWD-DP with ID 0x2BA01477 J-Link>SWDWriteDP 1 0x04000000 Write DP register 1 = 0x04000000 J-Link>exit

Reply
    1. Yes, for debugging I use JLinkExe and connect to target via SWD interface and default speed (4000 kHz), and on the power prfiler I see the current drain goes high (~4ma) this is expected. Also on terminating the JLinkExe or simply disconnecting the ribbon cable I am able to exit and see the current drain goes back to normal.

    However, for programming the chip and enabling the RBP I use nrfjprog tool, this should not enable debugging. Please confirm.

    1. Unfortunately I am not able to modify the target to test the setup.

    There seems to be an issue with different combinations of nrfjprog and Jlink that would not issue a soft reset to exit debug mode. I think this revision works okay:

    $ nrfjprog -v nrfjprog version: 9.3.1 JLinkARM.dll version: 6.18a

    After programming the chip via commands below the reset work okay and current drain goes down:

    $ nrfjprog -f NRF52 --program ./merged.hex --verify --chiperase --reset

    **But the --reset doesn't seem to work on this older rev combination for example: $ nrfjprog -v nrfjprog version: 8.5.0 JLinkARM.dll version: 6.12a

    (this is maybe the issue you are experiencing)

    **3) Please try these commands on your setup (you should see similar issue as I am experiencing):

    -program the kit and monitor with ppk at the same time (use a different debug kit for this as there seems to be an issue where the same debug kit can not be used to program and run ppk):

    $ nrfjprog -f NRF52 --program ./merged.hex --verify --chiperase --reset

    -enable rbp: $ nrfjprog -f NRF52 --rbp ALL

    (the chip should go to "sleep" with high current drain)

    -try the same command above again or force a "reset":

    $ nrfjprog -f NRF52 --reset ERROR: The operation attempted is unavailable due to readback protection in ERROR: your device. Please use --recover to unlock the device.

    (You should see higher current drain but wakes up the chip)

    Now launching the debugger (JLinkExe) and trying the command you mentioned as below would not still work as the chip is locked. The chip would go back to sleep with even higher current drain. Logs below:

    $ JLinkExe SEGGER J-Link Commander V6.18a (Compiled Aug 11 2017 17:53:58) DLL version V6.18a, compiled Aug 11 2017 17:53:53

    Connecting to J-Link via USB...O.K. Firmware: J-Link OB-SAM3U128-V2-NordicSemi compiled Jul 24 2017 17:30:12 Hardware version: V1.00 S/N: 681691590 VTref = 3.300V

    Type "connect" to establish a target connection, '?' for help J-Link>connect Please specify device / core. : NRF52832_XXAA Type '?' for selection dialog Device> Please specify target interface: J) JTAG (Default) S) SWD TIF>S Specify target interface speed [kHz]. : 4000 kHz Speed> Device "NRF52832_XXAA" selected.

    Connecting to target via SWD Found SW-DP with ID 0x2BA01477 CTRL-AP indicates that the device is secured. For debugger connection the device needs to be unsecured. Note: Unsecuring will trigger a mass erase of the internal flash. Device will be unsecured now. Found SW-DP with ID 0x2BA01477 Scanning AP map to find all available APs AP[2]: Stopped AP scan as end of AP map has been reached AP[0]: AHB-AP (IDR: 0x24770011) AP[1]: JTAG-AP (IDR: 0x02880000) Iterating through AP map to find AHB-AP to use AP[0]: Core found AP[0]: AHB-AP ROM base: 0xE00FF000 CPUID register: 0x410FC241. Implementer code: 0x41 (ARM) Found Cortex-M4 r0p1, Little endian. FPUnit: 6 code (BP) slots and 2 literal slots CoreSight components: ROMTbl[0] @ E00FF000 ROMTbl[0][0]: E000E000, CID: B105E00D, PID: 000BB00C SCS ROMTbl[0][1]: E0001000, CID: B105E00D, PID: 003BB002 DWT ROMTbl[0][2]: E0002000, CID: B105E00D, PID: 002BB003 FPB ROMTbl[0][3]: E0000000, CID: B105E00D, PID: 003BB001 ITM ROMTbl[0][4]: E0040000, CID: B105900D, PID: 000BB9A1 TPIU ROMTbl[0][5]: E0041000, CID: B105900D, PID: 000BB925 ETM Cortex-M4 identified. J-Link>SWDSelect Select SWD by sending SWD switching sequence. Found SWD-DP with ID 0x2BA01477 J-Link>SWDWriteDP 1 0x04000000 Write DP register 1 = 0x04000000 J-Link>exit

Children
No Data
Related