
Hello,
I'm testing PHY coding (for long range), I'm pretty surprise from what I get when I scan the RSSI of bluetooth channels (with Nordic app).
This is my set up:
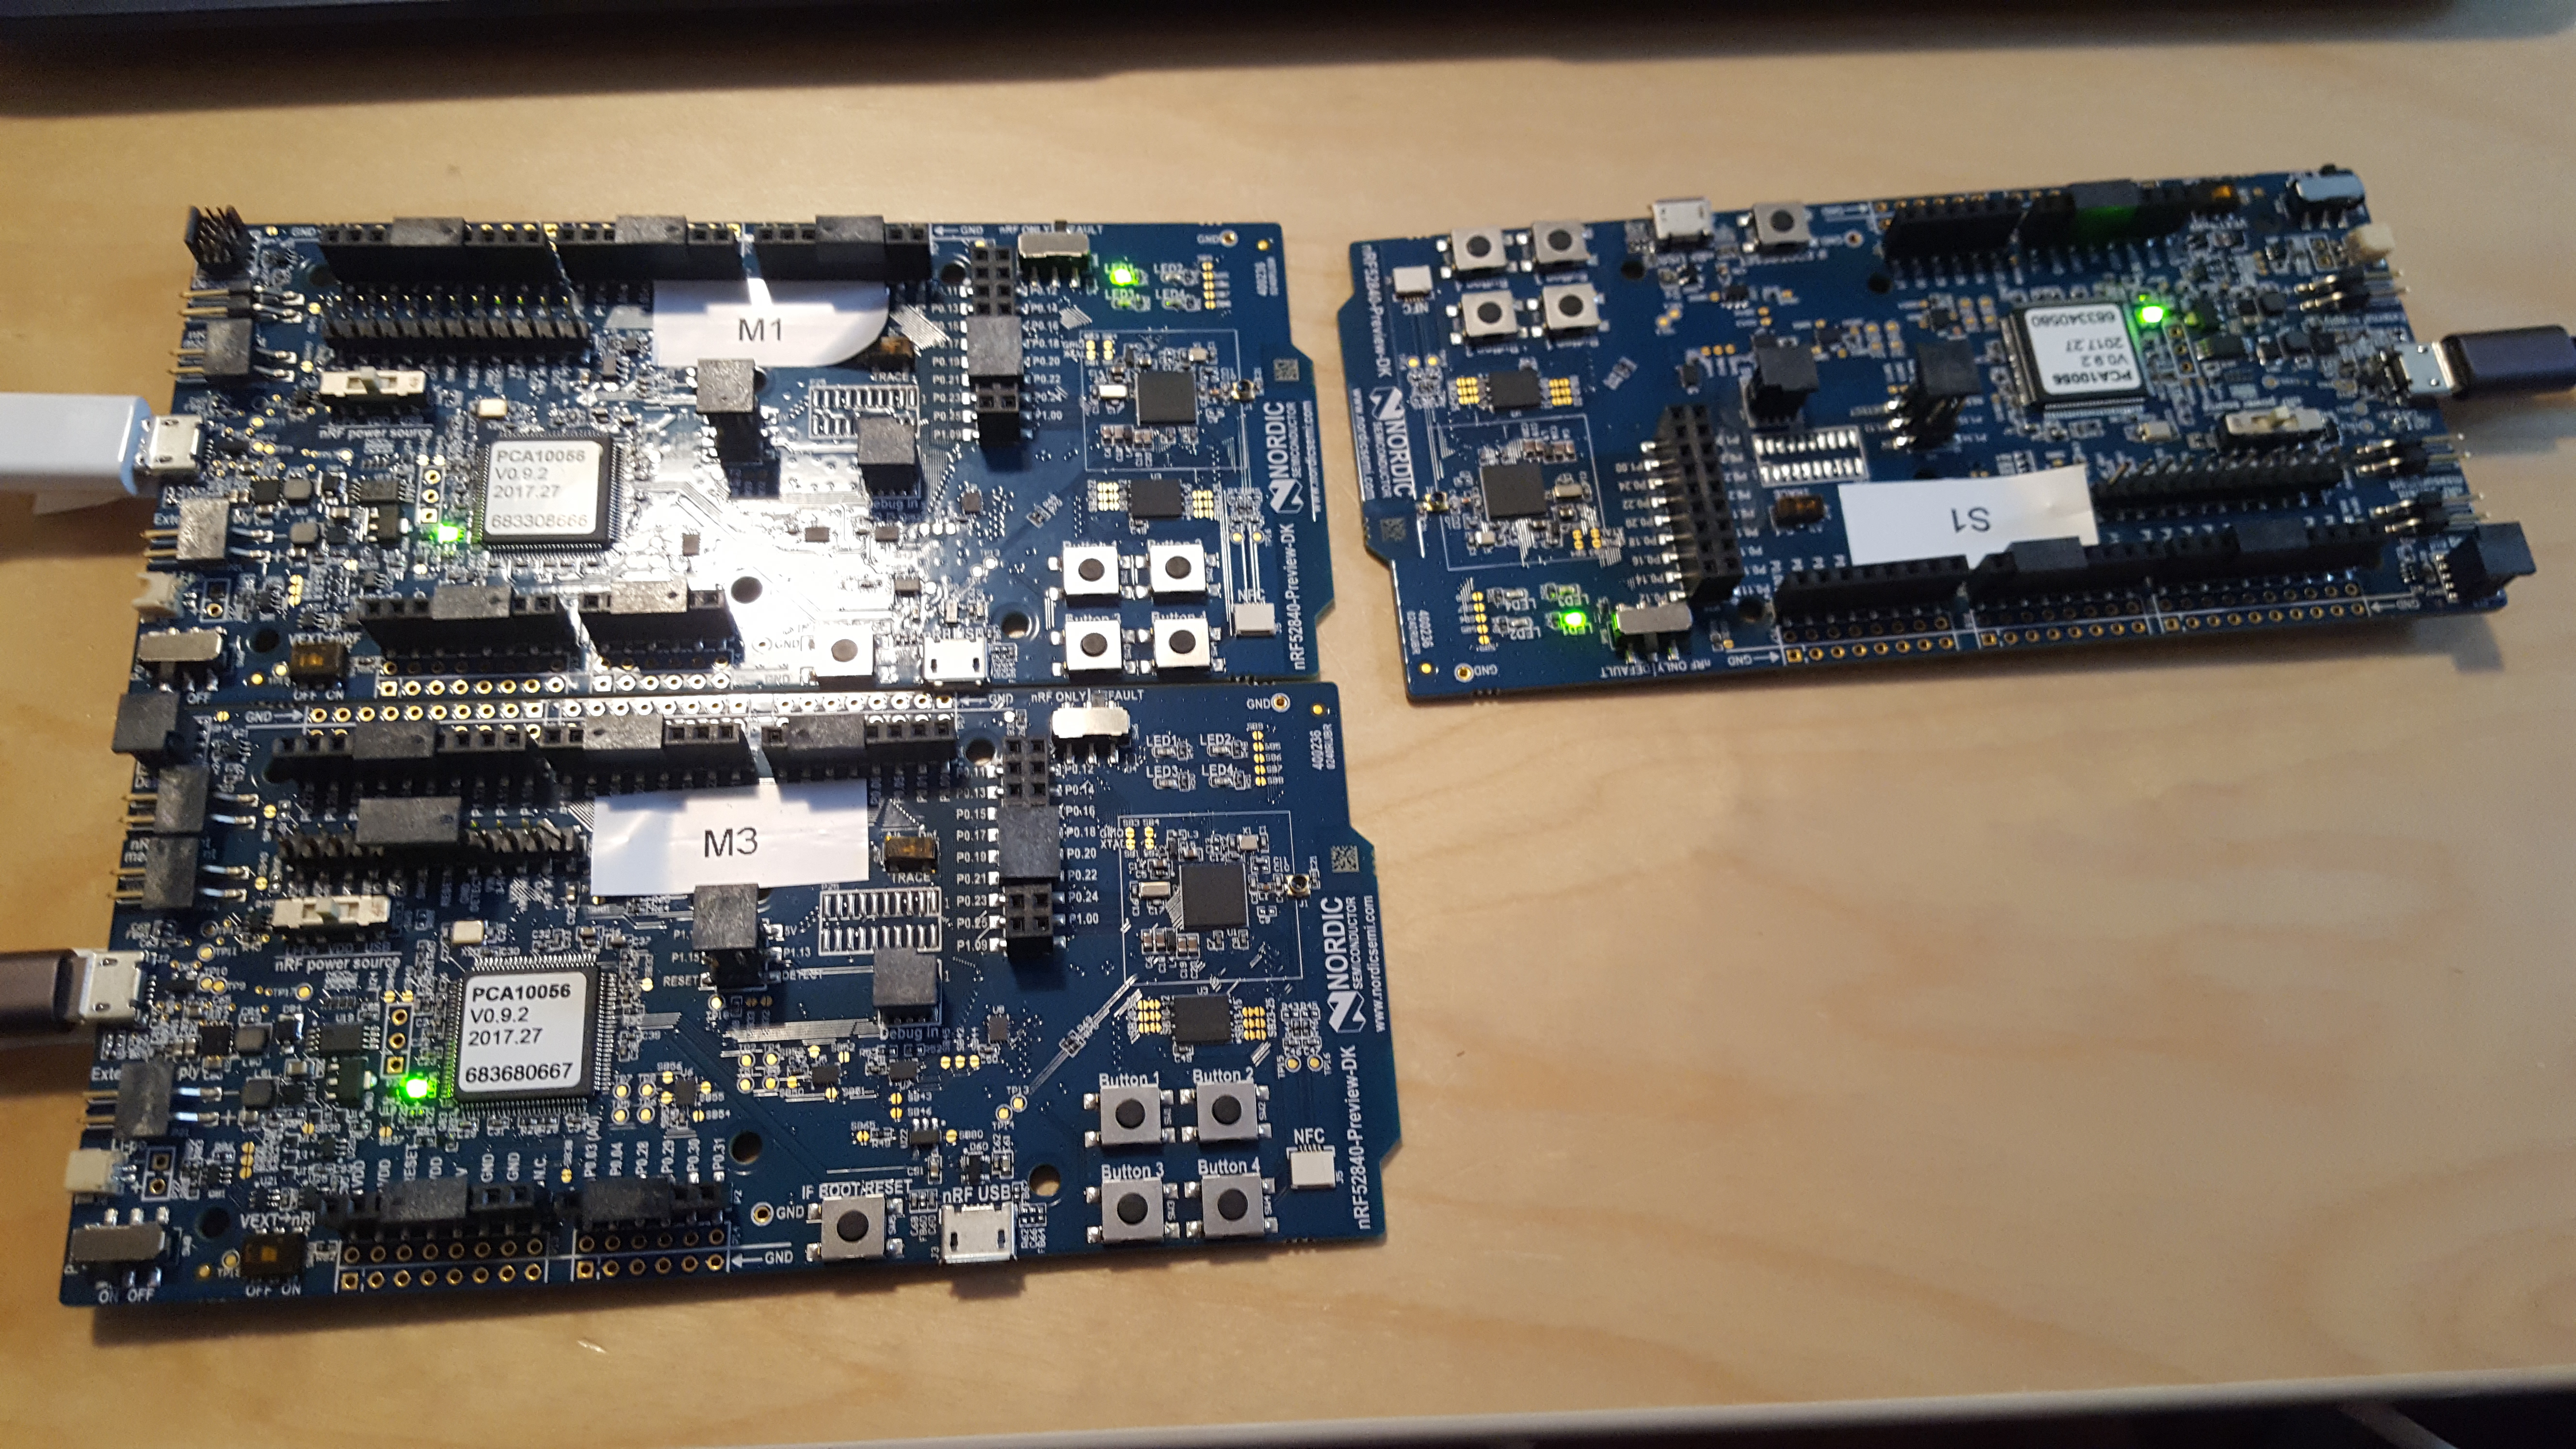
M1 is the central, S1 is the peripheral sending 1ko/s. (with uart exemple) I use softdevice 140 V5 alpha.2
M3 is the RSSI scanner connected to "Nordic app RSSI Viewer" Here are the results I get for phy= 1mbps (Short Range) and for phy=125kbps (coded-Long Range):
- Short Range
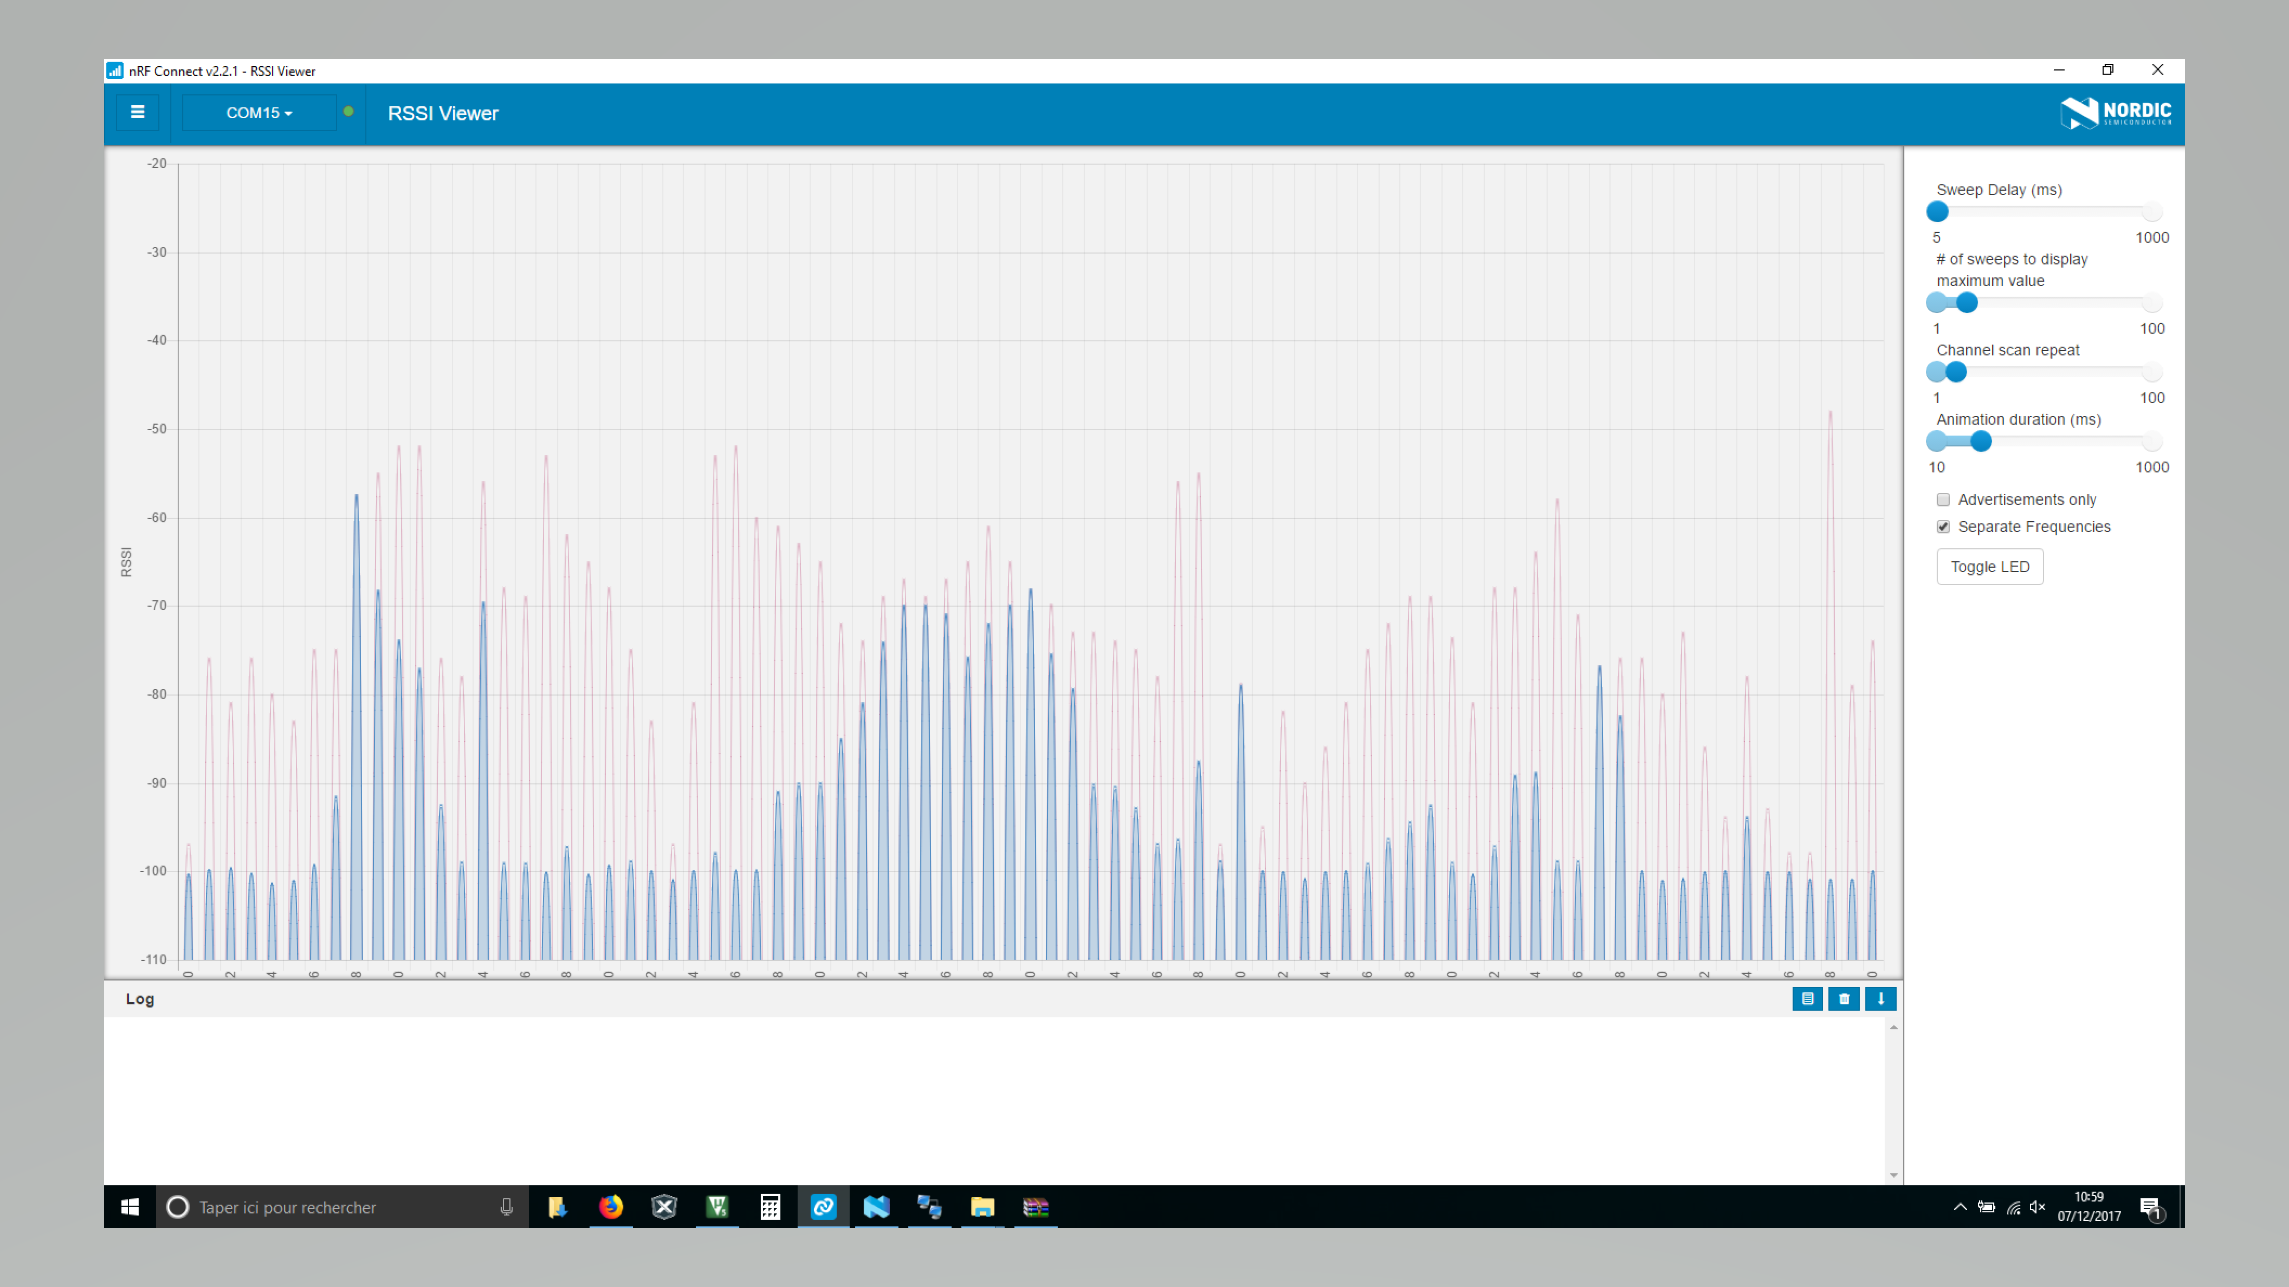
- Long Range
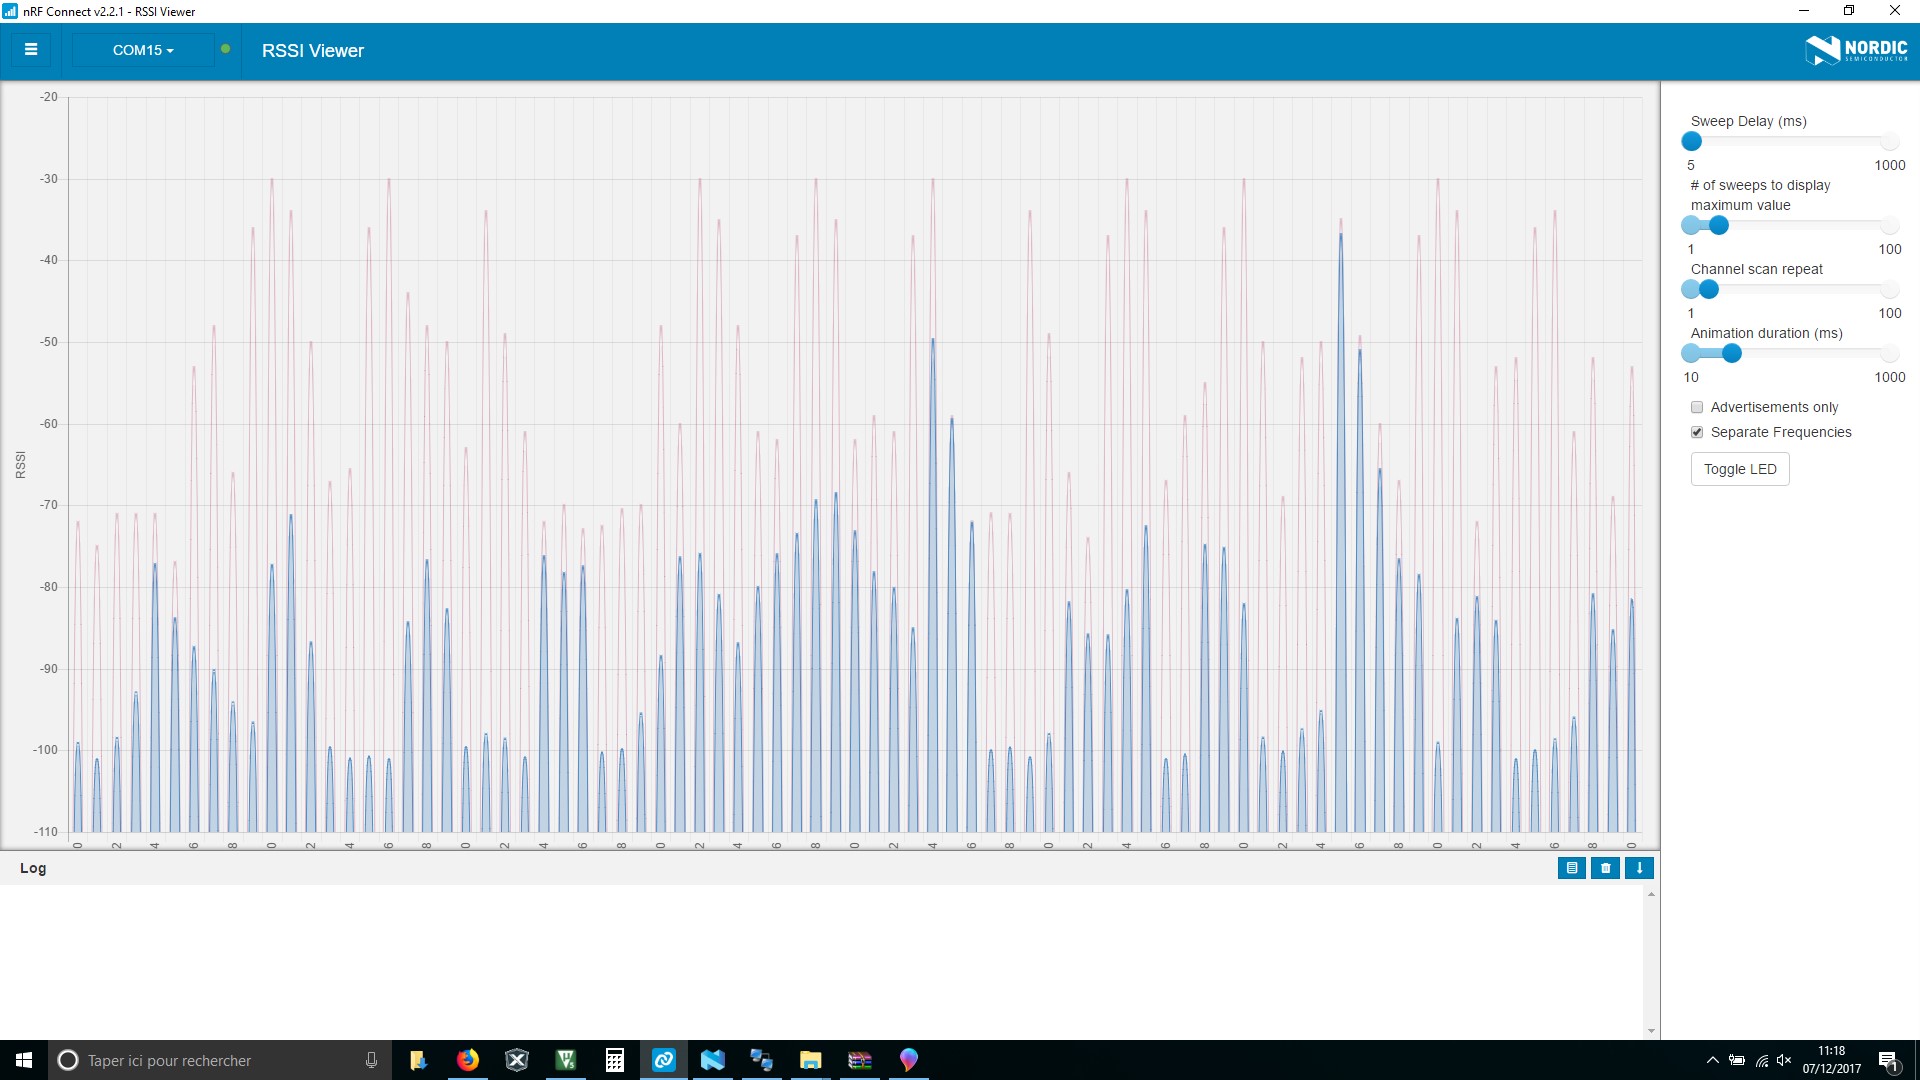
Can you explain me why the long Range mode trash all Bluetooth channels ? this is one link (S1-M1) so my data received is what I expected (1ko/s) but when I use 10 links, the data rate drops dramatically.
Regards,
-Damien
