Hello,
I am probably beating a dead horse here....
I am evaluating the PCA10056/nrf52840 preview DK and using the Keil/uVison 5.24.2 for that purpose.
I have found some instructions here on the devzone on how to get the ITM_Sendchar() to work for the smaller nRF52832 chip, e.g. Using SWO with nRF52 (redux) and Configuring SWO on nrf52.
What I have done is enable the SWO be defining ENABLE_SWO in the project settings and in the main() function (of the blinky example) changed to:
int main(void)
{
	CoreDebug->DEMCR |= CoreDebug_DEMCR_TRCENA_Msk;

    NRF_CLOCK->TRACECONFIG = (NRF_CLOCK->TRACECONFIG & ~CLOCK_TRACECONFIG_TRACEPORTSPEED_Msk) |
    (CLOCK_TRACECONFIG_TRACEPORTSPEED_4MHz << CLOCK_TRACECONFIG_TRACEPORTSPEED_Pos);

	NRF_CLOCK->TRACECONFIG |= CLOCK_TRACECONFIG_TRACEMUX_Serial << CLOCK_TRACECONFIG_TRACEMUX_Pos;

	NRF_P1->PIN_CNF[0] = (GPIO_PIN_CNF_DRIVE_H0H1 << GPIO_PIN_CNF_DRIVE_Pos) | (GPIO_PIN_CNF_INPUT_Connect << GPIO_PIN_CNF_INPUT_Pos) | (GPIO_PIN_CNF_DIR_Output << GPIO_PIN_CNF_DIR_Pos);

	ITM->TCR |= 1;
	ITM->TER |= 1;

    /* Configure board. */
    bsp_board_leds_init();

	while( 1 )
	{
		ITM_SendChar( 'H' );
		ITM_SendChar( '\r' );
		ITM_SendChar( '\n' );
		nrf_delay_ms( 1000 );
		bsp_board_led_invert(0);
	}
}
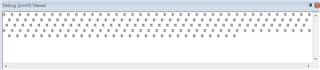
This does not give any output thought the Debug(printf) view of the Keil/uVison window.
Connecting to the pca10056 board via jlink.exe v.6.30f I get output, e.g.
c:>"c:\Program Files (x86)\SEGGER\JLink_V630f\JLink.exe" -if swd -device nrf52840_xxAA -speed auto
SEGGER J-Link Commander V6.30f (Compiled Mar  2 2018 17:29:33)
DLL version V6.30f, compiled Mar  2 2018 17:29:18

Connecting to J-Link via USB...O.K.
Firmware: J-Link OB-SAM3U128-V2-NordicSemi compiled Jan 12 2018 16:05:20
Hardware version: V1.00
S/N: 683615965
VTref = 3.300V


Type "connect" to establish a target connection, '?' for help
J-Link>connect
Device "NRF52840_XXAA" selected.


Connecting to target via SWD
Found SW-DP with ID 0x2BA01477
Found SW-DP with ID 0x2BA01477
Scanning AP map to find all available APs
AP[2]: Stopped AP scan as end of AP map has been reached
AP[0]: AHB-AP (IDR: 0x24770011)
AP[1]: JTAG-AP (IDR: 0x02880000)
Iterating through AP map to find AHB-AP to use
AP[0]: Core found
AP[0]: AHB-AP ROM base: 0xE00FF000
CPUID register: 0x410FC241. Implementer code: 0x41 (ARM)
Found Cortex-M4 r0p1, Little endian.
FPUnit: 6 code (BP) slots and 2 literal slots
CoreSight components:
ROMTbl[0] @ E00FF000
ROMTbl[0][0]: E000E000, CID: B105E00D, PID: 000BB00C SCS-M7
ROMTbl[0][1]: E0001000, CID: B105E00D, PID: 003BB002 DWT
ROMTbl[0][2]: E0002000, CID: B105E00D, PID: 002BB003 FPB
ROMTbl[0][3]: E0000000, CID: B105E00D, PID: 003BB001 ITM
ROMTbl[0][4]: E0040000, CID: B105900D, PID: 000BB9A1 TPIU
ROMTbl[0][5]: E0041000, CID: B105900D, PID: 000BB925 ETM
Cortex-M4 identified.
J-Link>swoview 4000000

Receiving SWO data @ 4000 kHz.
Data from stimulus port 0:
-----------------------------------------------
H
H
H
I also have an Segger J-trace debugger and connecting it to the debug port of the PCA10056 preview DK gives the same result, i.e. no output in the Keil environment and output when connected with jLink.exe
I am using ITM_sendchar() in a lpc1857 base project and the external j-trace debugger withouth problems.
This makes me believe this is not a problem with the debuggers themselves but something to do with the nrf52840/keil-uVision interaction.
Is there anyone experienced with ITM port usage on PCA10056/nrf52480?
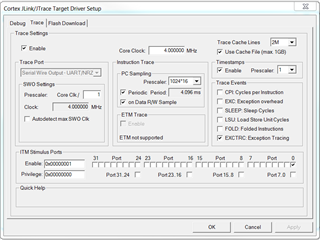
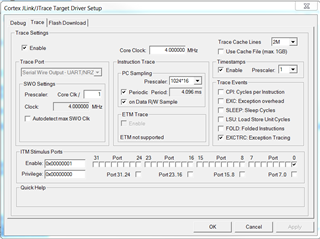
The Debugger settings in uVision are:
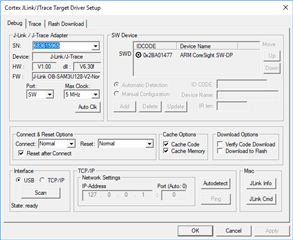
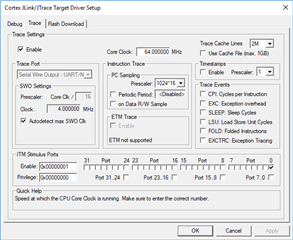
Setup:
Windows 10 pro
nrfS_SDK 14.2.0
Keil uVision 5.24.2
PCA10056 0.11.0 2018.3 683615965
External J-trace for ARM Cortex-M
Project modified as specified above : nRF5_SDK_14.2.0_17b948a\examples\peripheral\blinky\pca10056\blank\arm5_no_packs\blinky_pca10056.uvprojx project