This post is older than 2 years and might not be relevant anymore
More Info: Consider searching for newer posts

Not possible to use PPK while debugging

I am trying to measure the power consumption of a PCA10040 board while debugging, using the PPK. I am using the setup shown here: "Measuring current on nRF5 DK while debugging" with the slight change that I am using another PCA10040 board as JLink probe (as the nRF Connect v2.4.0 does not yet support a "real" JLink probe).

In detail, my setup is as follows. One PCA10040 board (naming this “DK A”) is connected with USB. The PPK is piggyback on DK A.

Another PCA10040 (“DK B”) is connected to the PPK with a 10 pin cable (Debug out on DK B is connected to Debug in on the PPK).

The COM SW3 is set to EXT.

SEGGER JLink version is V632i.


Steps to reproduce this problem

  1. Start a debugging session with IAR to DK A
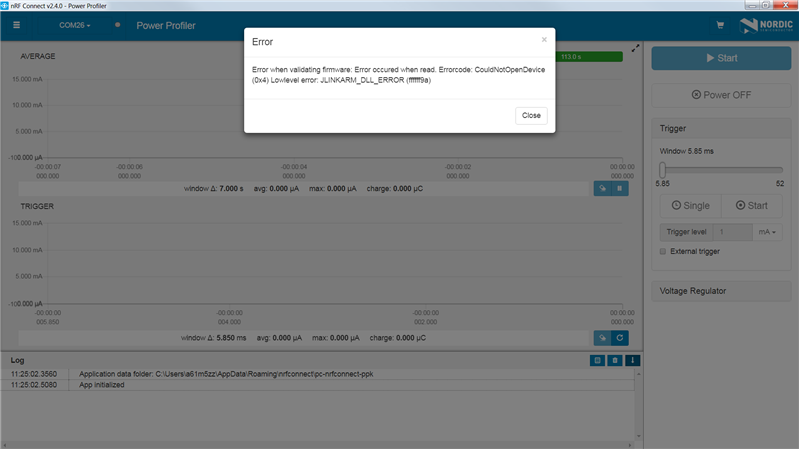
  2. Start nRF Connect v2.4.0 Power Profiler and try to connect to DK B. This error message is given ("JLINKARM_DLL_ERROR (ffffff9a)"):


Another way to reproduce this

  1. Start nRF Connect v2.4.0 Power Profiler and to connect to DK B
  2. Start a debugging session with IAR to DK A
  3. This will kick the Power Profiler app out (the measurement stops). After this, it is impossible to connect to DK A with the app, showing the error message of step 2 above
Parents Reply Children
  • Yes, I know that the measurements will be wrong when measuring at the same time as debugging. What I want to solve is this workflow:

    - Activate the measurement in the app RF Connect Power Profiler

    - Run the debugger (yes, the current consumption is wrong here but I can still do my usual cycle of compile/debug/recompile/debug/... before finding a state where my code actually seems to work)

    - When the code seems to be working, stop the debugger (or even remove the SWD 9 pin cable) to run the device in a "release" state, with realistic current measurements

    - When I need to reflash the device or start a compile/debug cycle again, I just reattach the SWD cable (although I have seen that it is enough to just stop the debugger in EWARM and keep the SWD cable connected. Most of the time this gives me somewhat useful measurements)

    But... My workflow right now looks like this, because of the above issue:

    - Activate the measurement

    - Run the debugger... But this crashes the Power Profiler app!

    - Stop the debugger

    - Close the Power Profiler app and open it again. Find the correct serial port. Start the measurement.... .... You see where this is going?

    Edit: So my point is, I am not looking for a solution to get good measurements while debugging. I just want to avoid having to close and reopen the Power Profiler app all the time just because the JLink crashes.

  • This was working in the beginning, but SEGGER has done some changes, breaking this feature for us. This means that the state of the debug lines to/from the PPK is wrong. The issue has been reported to SEGGER, and as soon as they'll update per our request this will not longer be a problem. 

    For now, the only viable thing to do is to not use the PPK at all if you need to do J-Link requests like flash, debug, RTT etc to the application board. And as a side note, CTRL+R will refresh the PPK app, making it faster to start it over :) 

Related