Hi everyone,
I want to change the Y-axis on the AVERAGE plot to show real-time data from 0 uA to 10 uA. The default setting is -100.000uA to 15.000 mA.
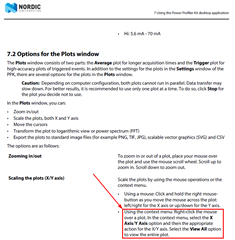
The PPK manual states on page 25 that I should be able to right-click over a plot and get a context menu to change the X-axis / Y-axis options. I am unable to make this context menu appear. For the record, this is with nRF Connect v2.6.2 - Power Profiler v2.1.0 on Windows 10.
I have also tried to zoom in by holding the right mouse button in and dragging the mouse down to zoom in on the y-axis. This works on frozen data, but as soon as I left click to show the real-time updating graph, the y-axis resets back to the default (-100 uA to 15 mA).
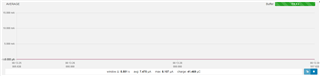
How do I change the y-axis to show the data of interest? Here is a graph with data from 0 uA to 10 uA:
Thanks in advance,
Pieter