Dear all,
I'm new to Ozone and hope that you will forgive the simplicity of my question.
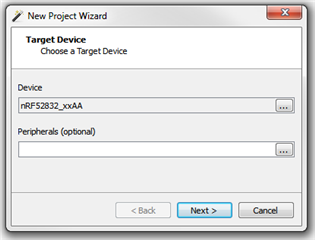
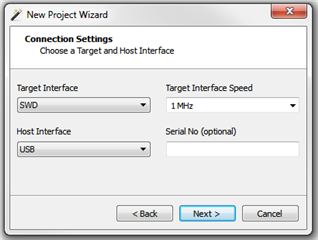
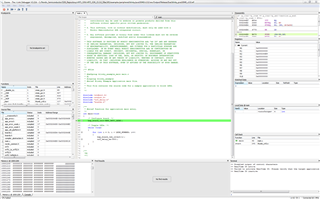
I'm trying to acquire a simple trace (Code Profile) of the blinky example with Ozone. To this purpose I have followed this document: J-Link User Guide and some other tutorials. I used the Ozone Project Wizard to setup it up, selecting the corresponding .elf file of this example under C:\Storage\nRF5_SDK_15.3.0\examples\periphera\blinky\pca10040\s132\ses\Output\Release\Exe\blinky_pca10040_s132.elf. Trouble is, Ozone can't find my main file and I therefore am not able to run the example. I get the following message:
Project warning (2071): file not found: C:\Storage\nRF5_SDK_15.3.0\examples\periphera\blinky\pca10040\s132\ses\Output\Release\Exe\blinky_pca10040_s132.elf.
I am using the following setup:
- nrf52832 DevKit with PCA10040
- J-Link EDU
- NRF5 SDK 15.3.0
- SES 4.16
- What do I need to change in order to be able to display and run this example in Ozone?
- Where should my .jdebug file be relative to the .elf file?
- How should my .jdebug look like?
Thank you for your help.
Oliver


