This post is older than 2 years and might not be relevant anymore
More Info: Consider searching for newer posts

Do I need to buy a Segger external debugger to get debug trace in Segger embedded studio?

Hello Nordic,

I hope you can help me. I'm using an NRF52840 DK development board. 

I followed the instructions on this video to enable debug trace in Segger embedded studio (https://www.youtube.com/watch?v=uP8RYgYGRvI)

When I debug I do not see any trace output. My build configuration is set to debug. 

I googled and found this page (https://devzone.nordicsemi.com/nordic/b/blog/posts/debugging-nrf52-series-devices-using-trace) which says

  • IMPORTANT: To use trace you need to have an external debugger that supports trace (trace won't work using the on-board debugger on our development kits). www.segger.com/jlink-debug-probes.html (see debug probes with built-in trace memory). IAR and ULink also offer debuggers that support trace and work with our devices.

The Segger debug probes are over $500.

I then found this page (https://devzone.nordicsemi.com/nordic/b/blog/posts/programming-and-debugging-custom-nrf5x-devices) which says 

  • When developing applications on a nRF5x Development Kit, you can program it by simply connecting it to your PC with a USB cable. This is possible because the Development Kit has an on-board debug unit supporting the JLINK debug interface.

I do not understand what I need to do to get debug trace in Segger embedded studio. 

My sdk_config.h has 

  • #define NRF_LOG_BACKEND_RTT_ENABLED 1
  • #define NRF_LOG_ENABLED 1

Thanks for your help,

-Jason

Parents Reply Children
  • Thanks Johannes, it solved the problem on my side at least. However, is this expected to happen after updating the Segger driver? Also, the same FW (before applying workaround) worked with RTT viewer and was only able to reproduce it on 52840, not nrf52832.  

  • Hi Vidar,

    This is only related to Embedded Studio, not the J-Link Firmware or Software.
    RTT viewer might behave differently then Embedded Studio.

    I don't know if there is a difference between your nRF52840 and nRF52832 projects.
    ES will always behave this way with \r\r\n and from our point of view this is an issue in the SDK.

    Regards
    Johannes

  • Thanks for the clarification. I'll report this as bug internally.

    Regards,

    Vidar 

  • I've just tried this but I still see nothing in the Debug Terminal, even using printf. 

    I tried putting this at the top of my sdk_config.h

    #define NRF_PRINTF_FLAG_AUTOMATIC_CR_ON_LF_ENABLED 0 

    and when that didn't work I tried changing the sdk_config.h to 

    #ifndef NRF_FPRINTF_FLAG_AUTOMATIC_CR_ON_LF_ENABLED
    #define NRF_FPRINTF_FLAG_AUTOMATIC_CR_ON_LF_ENABLED 0
    #endif

    When I look in my subversion diffs for that file, this is the only line that is changed. This is for 

    C:\nRF5_SDK_15.3.0_59ac345\examples\ble_peripheral\ble_app_uart

    The example uses both of these lines just before advertising_start() (line 738)

    printf("\r\nUART started.\r\n");
    NRF_LOG_INFO("Debug logging for UART over RTT started.");

    If I type some text into the Debug Terminal by pressing keys on my keyboard then they appear in the window. So it's not because of editor colours or something silly. When I step the debugger I see nothing from printf or NRF_LOG_INFO 

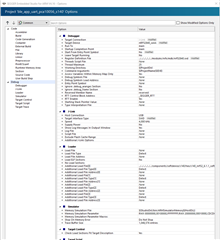
    I also checked my solution options but they look fine.

    Being paranoid cant hurt so I also changed the printf to printf("UART started."); to remove the escaped characters entirely but it still shows nothing. I then repeated the line 20 times to see if it was some weird buffering thing.

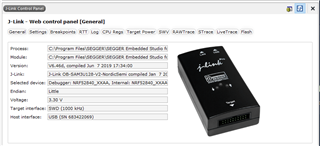
    My J-Link control panel looks like this

    All of this is running on Windows 10 but I had the same problem with Win7 

  • At this point I'd really suggest going back to basics. Write a hello world program using the SES template which if I remember correctly imports all the RTT headers for you and you can call RTT directly. Just have it print, wait (you can use a simple loop) then print again. If it doesn't, just pull them in yourself and do it. See if that works with the debug terminal. If not, load up the code and connect up the JLink RTT viewer and see if you can get that to work. 

    When you get to the point you can see RTT output, next thing is to find the RTT calls buried under the NRF macros, put a breakpoint in them and ensure they are actually being called. 

    That thread Johannes linked to mentioned the RTT tab on the JLink control panel as another place you can see raw RTT output - have you looked there? 

Related