This post is older than 2 years and might not be relevant anymore
More Info: Consider searching for newer posts

How to run Power Profiler Kit on top of nRF52832 with USB/UART communication line used by application

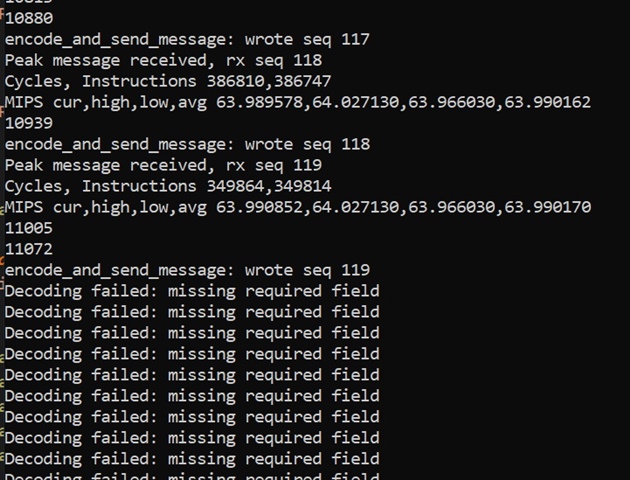
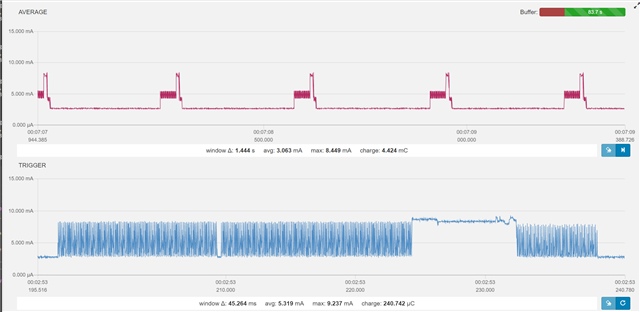
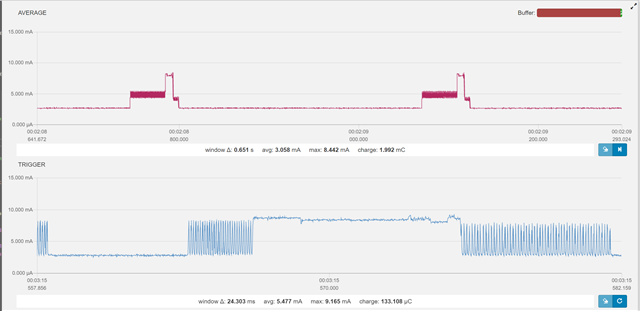
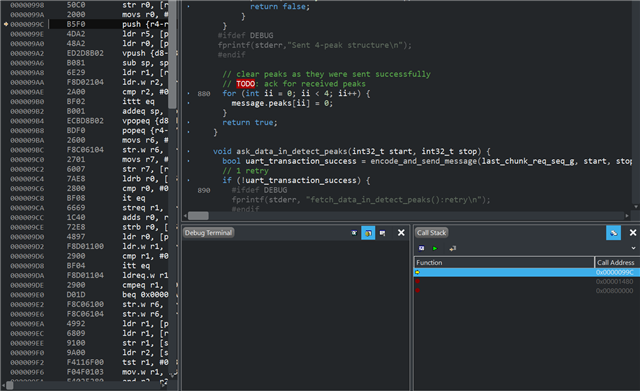
My setup: nRF52832 with nRF6707 on top.  My embedded application synchronously exchanges UART messages with a desktop application that feeds it data (on demand from embedded app).  I am interested in power profiling my embedded application . COM port is configured at 115200 baud. /8 byte/1 stop/ no parity/no flow control. With the power profiler running, I find that the desktop to embedded messages are getting in, but the return side hangs on UART's app_uart_put() byte. When I remove the power profiler, all is ok. 

How would I make both power profiler and UART app traffic work side by side?

Parents
  • Hi

    Are you able to see what error the app_uart_put returns? I assume the TX buffer might be full of "PPK data" which causes the app_uart_get to return NRF_ERROR_NO_MEM. Are you running the peripheral\uart example or have you made your own application, and what SDK are you using? If you're not using the SDK example, could you try flashing that to confirm that the PPK works alongside the UART example?

    Best regards,

    Simon

Reply
  • Hi

    Are you able to see what error the app_uart_put returns? I assume the TX buffer might be full of "PPK data" which causes the app_uart_get to return NRF_ERROR_NO_MEM. Are you running the peripheral\uart example or have you made your own application, and what SDK are you using? If you're not using the SDK example, could you try flashing that to confirm that the PPK works alongside the UART example?

    Best regards,

    Simon

Children
  • My example is built on top of your ble_app_uart example from nRF5_SDK_15.3.0_59ac345. I disabled the ble and timers from the example, left uart on, and added some DWT cycle counting and am using the event scheduler to notify my app that a full message was decoded from the uart interrupt byte buffer in the spirit of the example. My app sleeps in nrf_pwr_mgmnt_run() until a full message is decoded. 

            // Fetch new data
            fetched_new_data = false;
            ask_data_in_detect_peaks((int32_t)g_chunk_start, (int32_t)g_chunk_end);
            do {
              nrf_pwr_mgmt_run();
              app_sched_execute();
              NRF_LOG_PROCESS();
            } while (!fetched_new_data);

    I start in release mode (no debugger attached) with P22 unjumpered. The power profiler board sits on top. I don't use debugging from the power profiler. I have a single USB connected to the nrf52.

    My desktop sends 409 bytes of data, and my embedded app requests more data via a 49 bytes message.

    Today I was able to reproduce the problem once on my 119th message exchange

    (desktop view:)

    and once on my 2021th message exchange and once not at all. In the mean time, the power profiler runs ok. I can see the message exchanges and my embedded computation in between:

    Once in a while I get a big gap in my embedded byte-by-byte receive (left side of the pic below), suggesting something is getting in between (could it be Power Profiler communication)?

    When my app does hang, I try to attach debugger leaving P22 unjumpered, but this time it shows something in dissassembly with no stack information:

    At this point, I can live with the hang as I get the power measurement I need. 

Related