This post is older than 2 years and might not be relevant anymore
More Info: Consider searching for newer posts

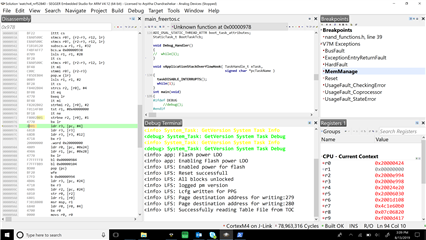
Bug unable to fix as going to unknown function 0x00000978..

Recently, we are using Nordic resources and developing our own application. We have blue tooth integrated in app, also we have display and our own file system integrated on our system. But , recently while debugging, after display got integrated , debugger automatically goes to unknown function at address 0x00000978. I researched what is it, came to know its soft device address and hence commented out blue tooth initialization from code. Also, I tried using IAR as similar segger, this doesn't go to unknown function but when debugger is paused it would have landed up in hard fault handler. This issue going to unknown function is there in debug mode, in release mode it will keep running not going to that address , but main file logging stops after may be 3 pages of flash memory. SO , couple of questions.

1. What is the difference between debug and release mode?

2. What is the difference between segger and IAR?

3. I am unable to see stack frame , list of functions how it landed up to this unknown function? How will I check from which function this issue is happening ? 

If any help please do let me know.

Regards

Arpitha M C

  • 1. What is the difference between debug and release mode?

    The only difference between debug and release mode is that Release mode optimizes the code for size and adds the NDEBUG definition to the preprocessor definitions. Debug mode does not use any optimization and adds the following preprocessor definitions DEBUG and DEBUG_NRF

    2. What is the difference between segger and IAR?

    There are many differences, but i guess the main one is that Segger Embedded Studio uses the GCC compiler, while IAR has its own compiler. 

    3. I am unable to see stack frame , list of functions how it landed up to this unknown function? How will I check from which function this issue is happening ? 

    The address 0x00000978 is located in the MBR, which is distributed together with the SoftDevice, see the Memory resource map and usage, as a precompiled binary. 

    This means that there are no debug symbols and debug information for the debugger, you're just able to see the disassembly. 

    If you provide me with the SoftDevice version number, then I can check what code that is placed at 0x00000978 in the MBR. 

    Best regards

    Bjørn


  • Hi ,

         Soft device version number is s140, 6.1.0. Also, i can see break point is getting hit at MemManage, is this issue with memory management. How can i read more about break points to see issue of memory management.

    Regards

    Arpitha M C.

  • According to the Cortex M4 Devices Generic User Guide, found here

     A MemManage fault is an exception that occurs because of a memory protection related fault. The the fixed memory protection constraints determines this fault, for both instruction and data memory transactions. This fault is always used to abort instruction accesses to Execute Never (XN) memory regions.

    So this means that your application is likely writing to a protected region. Are you able to indentify the last function call prior to entering the MemManage handler?

  • Hi,

                  Unfortunately I am not able to find out from which function its entering this mem manager. I have attached snap of program. It hits break point at Mem manage. However, I am able to see from IAR where it is entering. But again, IAR keeps running unlike segger which goes to unknown function but when paused it would have hit Hard Fault handler. So, in this case how do I be able to debug? 

    Regards

    Arpitha M C

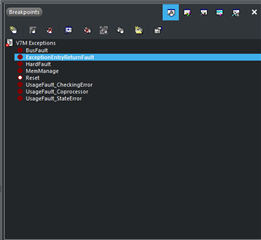
  • It could be that the program  have entered the hardfault exception handler inside the MBR. It's normally forwarded to the main application, but will get trapped if breakpoint on hardfault is enabled in SES. Make sure you have this breakpoint disabled in the breakpoints view.

    Breakpoints window. Start a debug session and use Ctrl+Alt+b to open view. 

    This should ensure that the hardfault exception is forwarded to the application. Then you try to  use the HardFault handling library to determine the cause of the Hardfault.

Related