Starting with the BLE Uart Service example code, I wanted to send longer length packets, so the necessitated modifying settings like NRF_SDH_BLE_GATT_MAX_MTU_SIZE, NRF_SDH_BLE_GAP_DATA_LENGTH, NRF_SDH_BLE_GAP_DATA_LENGTH, etc, which then modifies the memory requirements of the BLE stack. The need to modify the ram settings is is fine, and is the expected behaviour.
So, running the code in the segger debugger, with it configured with logging enabled at NRF_SDH_BLE_LOG_LEVEL 4, for RTT debug output to the debug window I would have expected it to provide helpful debug output (as per the tutorial video at https://www.youtube.com/watch?v=uP8RYgYGRvI ) to tell me what the new RAM settings shoud be.
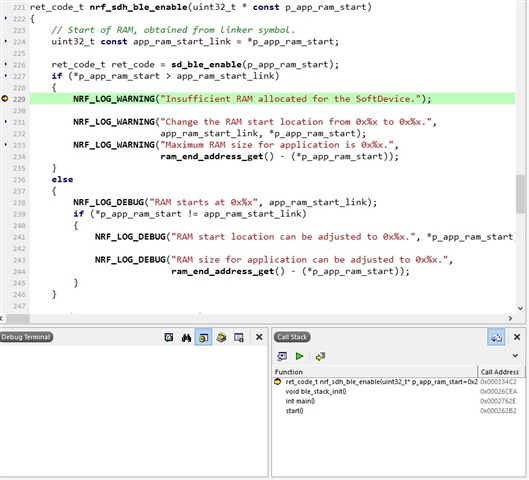
However when the code executes the following line of code, the NRF_LOG_WARNING code goes mad.

Just the very bottom line of the segger Debug Terminal window flickers furiously with the words "Insufficient RAM allocated for the Soft Device". There is no scrolling of the window, and no other messages. If I pause it, the debug terminal is blank as it is constantly being cleared by something.
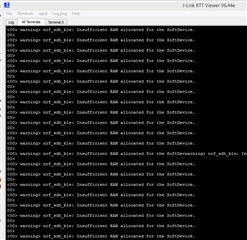
By attaching the external J-Link viewer, I can see the following stream of output:

etc.
i.e. it is just repeatedly printing the same warning message, without moving on to subsequent lines of code, and therefore it never gets to print out the helpful messages that tell me what I should set the ram start and ram size values to.
There are work-arounds I can use to find those ram values, but the main issue here is that debug logging isn't working properly.

