This post is older than 2 years and might not be relevant anymore
More Info: Consider searching for newer posts

ISSUES DUE TO "UNABLE TO FIND OR OPEN THE JlinkARM.dll"

HI,

  •  We are mainly using "nRFgo Studio" and "nRF Connect" application for erasing and flashing codes to our custom board and its taking place successfully for a long time.
  • The hardware tools we are using for flashing the code is "J-LINK BASE " version 10.1.
  • But now  we can't able to flash or erase the code to our custom board either with "nRFgo Studio" or nRF  Connect.I don,t known why its happening?

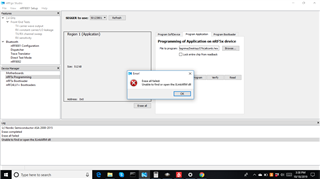
When i tried to erase the code in our custom board using "nRFgo Studio"

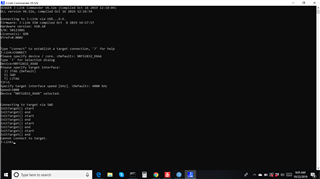
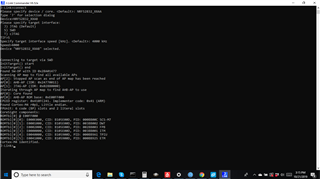
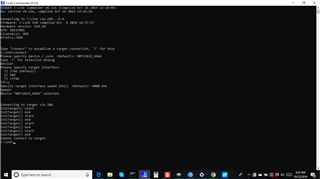
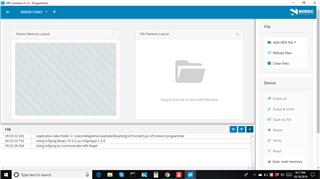
When i tried to read our custom board using "nRF_Connect" its not reading look the below screen shot

DOUBTS

  • What is the reason behind these issues?
  • Is it a problem with our custom board or with jlink tool?
  • What are the solution for these problems?

Please reply as soon as you can possible . Its a major issue with us.

  • Håkon Alseth said:
    What version of nrfjprog are you using? If it is old, then that might be the problem.

     nrfjprog version: 9.8.1
    JLinkARM.dll version: 6.52e


    Håkon Alseth said:
    Link Commander seems to be able to connect successfully, you can try to read out the memory using "mem32 0,100", which will read the first 100 words in flash.

     No Hakon we can't able to connect with jlink Commander look the below screen shot same issue are showing with those boards

  • I updated version of nrfjprog now also the same issues where showing.

    nrfjprog version: 10.4.0
    JLinkARM.dll version: 6.52e

    I can't able to read or write to our custom through "nrf_Connect","nRFgo Studio" and also with "Jlink commander" .

    Please give me a suitable solution to rectify these problem.

  • This image that you posted:

    Showed a successful connection to the nRF52832 device.

    If you had followed up with a "mem32 0, 100" that should have given you the first 100 words in flash.

    What has likely happened with your device is that it is asserting, where it then resets. If this happens very early in the boot-up sequence, it is very hard to recover the chip, as it does take a bit of time before the debugger is successfully attaching to the device.

    If that is the case, you can try this script: https://devzone.nordicsemi.com/f/nordic-q-a/45078/nrf52832-not-connected-anymore-after-first-trying-to-debug-keil/177579#177579


    But, what is interesting in your latest picture is that the sampled voltage is 0.00V. Is the "VREF" pin not connected to the 10 pin programming header? Your debugger does not have any information about the target voltage of your custom board, so it has to guess what it is (or; just try to connect with 3.0V).


    Kind regards,

    Håkon

  • Håkon Alseth said:
    Showed a successful connection to the nRF52832 device.

     That image is from working board not from the boards showing these issue. Sorry for the confusion


    Håkon Alseth said:
    But, what is interesting in your latest picture is that the sampled voltage is 0.00V. Is the "VREF" pin not connected to the 10 pin programming header?

     The voltage is not showing because i open the jlink commander without custom board connected to debugger that's why its look like that.

    look these screen shot your doubt will clear


    Håkon Alseth said:
    the 10 pin programming header

     we are programming through a 6 pin needle connector not a 10 pin . 

    we are only using(SWDIO,SWCLK,GND,VDD) .

Related