Hi Devzone!
I'm using the fft function to check the frequency of sound from mic sensor.
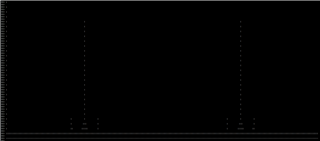
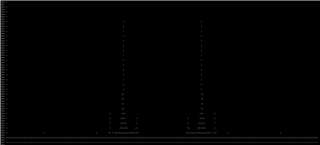
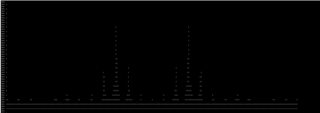
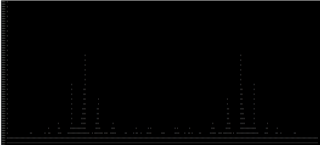
All seems good but, only up to 2500hz is shown and the frequency above it is shifted to the left and when it reaches to 0, it is shifted to the right.
When I used fpu-fft, and generated sin function, the graph can show the value up to 20000hz.
How can I change the limit of x-axis?
The whole code is below,
/**
* Copyright (c) 2014 - 2019, Nordic Semiconductor ASA
*
* All rights reserved.
*
* Redistribution and use in source and binary forms, with or without modification,
* are permitted provided that the following conditions are met:
*
* 1. Redistributions of source code must retain the above copyright notice, this
* list of conditions and the following disclaimer.
*
* 2. Redistributions in binary form, except as embedded into a Nordic
* Semiconductor ASA integrated circuit in a product or a software update for
* such product, must reproduce the above copyright notice, this list of
* conditions and the following disclaimer in the documentation and/or other
* materials provided with the distribution.
*
* 3. Neither the name of Nordic Semiconductor ASA nor the names of its
* contributors may be used to endorse or promote products derived from this
* software without specific prior written permission.
*
* 4. This software, with or without modification, must only be used with a
* Nordic Semiconductor ASA integrated circuit.
*
* 5. Any software provided in binary form under this license must not be reverse
* engineered, decompiled, modified and/or disassembled.
*
* THIS SOFTWARE IS PROVIDED BY NORDIC SEMICONDUCTOR ASA "AS IS" AND ANY EXPRESS
* OR IMPLIED WARRANTIES, INCLUDING, BUT NOT LIMITED TO, THE IMPLIED WARRANTIES
* OF MERCHANTABILITY, NONINFRINGEMENT, AND FITNESS FOR A PARTICULAR PURPOSE ARE
* DISCLAIMED. IN NO EVENT SHALL NORDIC SEMICONDUCTOR ASA OR CONTRIBUTORS BE
* LIABLE FOR ANY DIRECT, INDIRECT, INCIDENTAL, SPECIAL, EXEMPLARY, OR
* CONSEQUENTIAL DAMAGES (INCLUDING, BUT NOT LIMITED TO, PROCUREMENT OF SUBSTITUTE
* GOODS OR SERVICES; LOSS OF USE, DATA, OR PROFITS; OR BUSINESS INTERRUPTION)
* HOWEVER CAUSED AND ON ANY THEORY OF LIABILITY, WHETHER IN CONTRACT, STRICT
* LIABILITY, OR TORT (INCLUDING NEGLIGENCE OR OTHERWISE) ARISING IN ANY WAY OUT
* OF THE USE OF THIS SOFTWARE, EVEN IF ADVISED OF THE POSSIBILITY OF SUCH DAMAGE.
*
*/
/**
* @brief BLE LED Button Service central and client application main file.
*
* This example can be a central for up to 8 peripherals.
* The peripheral is called ble_app_blinky and can be found in the ble_peripheral
* folder.
*/
#include <stdbool.h>
#include <stdint.h>
#include <stdio.h>
#include <string.h>
#include "nordic_common.h"
#include "compiler_abstraction.h"
#include "nrf.h"
#include "app_error.h"
#include "app_uart.h"
#include "nrf_sdh.h"
#include "nrf_sdh_ble.h"
#include "app_timer.h"
#include "bsp_btn_ble.h"
#include "ble.h"
#include "ble_hci.h"
#include "ble_advertising.h"
#include "ble_conn_params.h"
#include "ble_db_discovery.h"
#include "app_util.h"
#include "ble_nus_c.h"
#include "ble_conn_state.h"
#include "nrf_ble_gatt.h"
#include "nrf_pwr_mgmt.h"
#include "nrf_ble_scan.h"
#include "nrf_drv_ppi.h"
#include "nrf_drv_saadc.h"
#include "nrf_drv_timer.h"
#include "nrf_delay.h"
#include "nrf_twi.h"
#include "nrf_drv_twi.h"
#include "nrf_twi_mngr.h"
#include "nrf_twi_sensor.h"
#include "iis2dlpc.h"
#include "boards.h"
#include "nrf_log.h"
#include "nrf_log_ctrl.h"
#include "nrf_log_default_backends.h"
#include "app_util_platform.h"
#include "bsp.h"
/*lint -save -e689 */ /* Apparent end of comment ignored */
#include "arm_const_structs.h"
/*lint -restore */
#define APP_BLE_CONN_CFG_TAG 1 /**< Tag that refers to the BLE stack configuration that is set with @ref sd_ble_cfg_set. The default tag is @ref APP_BLE_CONN_CFG_TAG. */
#define APP_BLE_OBSERVER_PRIO 3 /**< BLE observer priority of the application. There is no need to modify this value. */
#define UART_TX_BUF_SIZE 256 /**< UART TX buffer size. */
#define UART_RX_BUF_SIZE 256 /**< UART RX buffer size. */
#define CENTRAL_SCANNING_LED BSP_BOARD_LED_0
#define CENTRAL_CONNECTED_LED BSP_BOARD_LED_1
#define LEDBUTTON_LED BSP_BOARD_LED_2 /**< LED to indicate a change of state of the Button characteristic on the peer. */
#define LEDBUTTON_BUTTON BSP_BUTTON_0 /**< Button that writes to the LED characteristic of the peer. */
#define BUTTON_DETECTION_DELAY APP_TIMER_TICKS(50) /**< Delay from a GPIOTE event until a button is reported as pushed (in number of timer ticks). */
#define NUS_SERVICE_UUID_TYPE BLE_UUID_TYPE_VENDOR_BEGIN /**< UUID type for the Nordic UART Service (vendor specific). */
#define ECHOBACK_BLE_UART_DATA 0 /**< The flag whether central sends peripheral the received message again */
#define DIFF_SIZE 10 /**< difference 0~2 arrays size. */
#define II_ADDR (0x33U >>1) /**< IIS2DLPC Sensor Adress. */
#define MAX_PENDING_TRANSACTIONS 4 /**< Maximum numbers of pending transactions. */
#define SAMPLES_IN_BUFFER 4 /**< The number of analog sensors */
#define SAADC_SAMPLE_RATE 250 /**< The sampling rate of saadc */
#define FLAME_PIN NRF_SAADC_INPUT_AIN0 /**< The hadware pin for flame detect sensor */
#define SOUND_PIN NRF_SAADC_INPUT_AIN1 /**< The hadware pin for mic sensor */
#define HUMID_PIN NRF_SAADC_INPUT_AIN2 /**< The hadware pin for soil-moisture sensor */
#define BAT_PIN NRF_SAADC_INPUT_VDD /**< The hadware pin for battery(vdd) */
#define FLAME_CHANNEL 0 /**< The saadc module channel of flame detect sensor */
#define SOUND_CHANNEL 1 /**< The saadc module channel of mic sensor */
#define HUMID_CHANNEL 2 /**< The saadc module channel of soil-moisture sensor */
#define BAT_CHANNEL 3 /**< The saadc module channel of battery(vdd) */
#define ADC_REF_VOLTAGE_IN_MILLIVOLTS 600 /**< Reference voltage (in milli volts) used by ADC while doing conversion. */
#define ADC_PRE_SCALING_COMPENSATION 6 /**< The ADC is configured to use VDD with 1/3 prescaling as input. And hence the result of conversion is to be multiplied by 3 to get the actual value of the battery voltage.*/
#define DIODE_FWD_VOLT_DROP_MILLIVOLTS 270 /**< Typical forward voltage drop of the diode . */
#define ADC_RES_10BIT 1024 /**< Maximum digital value for 10-bit ADC conversion. */
#define ADC_RESULT_IN_MILLI_VOLTS(ADC_VALUE)\
((((ADC_VALUE) * ADC_REF_VOLTAGE_IN_MILLIVOLTS) / ADC_RES_10BIT) * ADC_PRE_SCALING_COMPENSATION) /**< The mathematical expression for converting the value of saadc(vdd) as milli volts unit. */
#define GRAPH_WINDOW_HEIGHT 53 /**< Graph window height used in draw function. */
#define FPU_EXCEPTION_MASK 0x0000009F /**< FPU exception mask used to clear exceptions in FPSCR register. */
#define FPU_FPSCR_REG_STACK_OFF 0x40 /**< Offset of FPSCR register stacked during interrupt handling in FPU part stack. */
#define FFT_TEST_COMP_SAMPLES_LEN 512 /**< Complex numbers input data array size. Correspond to FFT calculation this number must be power of two starting from 2^5 (2^4 pairs) with maximum value 2^13 (2^12 pairs). */
#define FFT_TEST_OUT_SAMPLES_LEN (FFT_TEST_COMP_SAMPLES_LEN / 2) /**< Output array size. */
//#define ACCEL_FFT_PRINT
#define SOUND_FFT_PRINT
#ifdef ACCEL_FFT_PRINT
#define Y_PRINT
//#define TIMECHECK /**< The flag of checking execution time. */
#ifdef X_PRINT
#define OUTPUT_PORT x_output
#endif
#ifdef Y_PRINT
#define OUTPUT_PORT y_output
#endif
#ifdef Z_PRINT
#define OUTPUT_PORT z_output
#endif
#endif
#ifdef SOUND_FFT_PRINT
#define OUTPUT_PORT sound_output
#endif
NRF_BLE_GATT_DEF(m_gatt); /**< GATT module instance. */
BLE_NUS_C_ARRAY_DEF(m_ble_nus_c, NRF_SDH_BLE_TOTAL_LINK_COUNT);
BLE_DB_DISCOVERY_ARRAY_DEF(m_db_disc, NRF_SDH_BLE_TOTAL_LINK_COUNT); /**< Database discovery module instances. */
NRF_BLE_SCAN_DEF(m_scan); /**< Scanning Module instance. */
NRF_TWI_MNGR_DEF(m_nrf_twi_mngr, MAX_PENDING_TRANSACTIONS, 0); /**< TWI transaction manager instance. */
NRF_TWI_SENSOR_DEF(m_nrf_twi_sensor, &m_nrf_twi_mngr, NRF_TWI_SENSOR_SEND_BUF_SIZE); /**< TWI sensor instance. */
static nrf_saadc_channel_config_t ch_config_flame = NRF_DRV_SAADC_DEFAULT_CHANNEL_CONFIG_SE(FLAME_PIN); /**< The saadc cnannel configuration of flame detect sensor. */
static nrf_saadc_channel_config_t ch_config_sound = NRF_DRV_SAADC_DEFAULT_CHANNEL_CONFIG_SE(SOUND_PIN); /**< The saadc cnannel configuration of mic sensor. */
static nrf_saadc_channel_config_t ch_config_humid = NRF_DRV_SAADC_DEFAULT_CHANNEL_CONFIG_SE(HUMID_PIN); /**< The saadc cnannel configuration of soil-moisture sensor. */
static nrf_saadc_channel_config_t ch_config_bat = NRF_DRV_SAADC_DEFAULT_CHANNEL_CONFIG_SE(BAT_PIN); /**< The saadc cnannel configuration of battery(vdd). */
static const nrf_drv_timer_t m_timer = NRF_DRV_TIMER_INSTANCE(3); /**< The channel of used timer triver. */
static char const m_target_periph_name[] = "Nordic_Blinky"; /**< Name of the device to try to connect to. This name is searched for in the scanning report data. */
static axis3bit16_t data_raw_acceleration; /**< Load raw data from iis2dlpc sensor into this variable. */
static iis2dlpc_ctx_t dev_ctx; /**< Handle iis2dlpc sensor's read/write instance with this variable. */
static uint8_t whoamI, rst; /**< Validate iis2dlpc sensor address and status to use. */
static float acceleration_mg[3]; /**< Convert raw data to float(usable) data into this variable by using iis2dlpc sdk. */
static int current_value[3]; /**< Current data to use dto62 private function. */
static int previous_value[3] = {0}; /**< Previous data to use dto62 private function. */
static char difference0[DIFF_SIZE]; /**< X-axis Difference between Previous data and Current data converted by dto62 private function. */
static char difference1[DIFF_SIZE]; /**< Y-axis Difference between Previous data and Current data converted by dto62 private function. */
static char difference2[DIFF_SIZE]; /**< Z-axis Difference between Previous data and Current data converted by dto62 private function. */
static char m_buffer[DIFF_SIZE*3]; /**< Buffer to print all the difference data. */
static float calib_offset[3];
static nrf_saadc_value_t m_buffer_pool[4][SAMPLES_IN_BUFFER]; /**< The storage of 4 values which are results of saadc. */
static nrf_ppi_channel_t m_ppi_channel; /**< The ppi instance for interconnecting timer and saadc. */
static uint16_t m_ble_nus_max_data_len = BLE_GATT_ATT_MTU_DEFAULT - OPCODE_LENGTH - HANDLE_LENGTH; /**< The maximum length of ble data. */
static uint8_t m_ble_nus_c_count; /**< The instance of present connected count of ble devices. */
static uint16_t accel_counter = 0; /**< The counter used for counting the excution counts of iss2dlpc. */
static uint16_t sound_counter = 0; /**< The counter used for checking excution time. */
static uint32_t m_ifft_flag = 0; /**< Flag that selects forward (0) or inverse (1) transform. */
static uint32_t m_do_bit_reverse = 1; /**< Flag that enables (1) or disables (0) bit reversal of output. */
//static float32_t m_fft_input_f32[FFT_TEST_COMP_SAMPLES_LEN]; /**< FFT input array. Time domain. */
//static float32_t m_fft_output_f32[FFT_TEST_OUT_SAMPLES_LEN]; /**< FFT output data. Frequency domain. */
#ifdef TIMECHECK
static uint16_t counter = 0; /**< The counter used for checking excution time. */
static uint32_t start; /**< The time recorded when program starts. */
static uint32_t stop; /**< The time recorded when program terminates. */
static uint32_t elapsed; /**< The execution time. */
#endif
typedef struct
{
float32_t x_input[FFT_TEST_COMP_SAMPLES_LEN];
float32_t y_input[FFT_TEST_COMP_SAMPLES_LEN];
float32_t z_input[FFT_TEST_COMP_SAMPLES_LEN];
float32_t sound_input[FFT_TEST_COMP_SAMPLES_LEN];
} m_fft_input_f32;
typedef struct
{
float32_t x_output[FFT_TEST_OUT_SAMPLES_LEN];
float32_t y_output[FFT_TEST_OUT_SAMPLES_LEN];
float32_t z_output[FFT_TEST_OUT_SAMPLES_LEN];
float32_t sound_output[FFT_TEST_OUT_SAMPLES_LEN];
} m_fft_output_f32;
static m_fft_input_f32 fft_input;
static m_fft_output_f32 fft_output;
static ble_uuid_t const m_nus_uuid = /**< Universally unique service identifiers. */
{
.uuid = BLE_UUID_DEVICE_INFORMATION_SERVICE,
.type = BLE_UUID_TYPE_BLE
};
/**@brief Function for handling asserts in the SoftDevice.
*
* @details This function is called in case of an assert in the SoftDevice.
*
* @warning This handler is only an example and is not meant for the final product. You need to analyze
* how your product is supposed to react in case of an assert.
* @warning On assert from the SoftDevice, the system can only recover on reset.
*
* @param[in] line_num Line number of the failing assert call.
* @param[in] p_file_name File name of the failing assert call.
*/
void assert_nrf_callback(uint16_t line_num, const uint8_t * p_file_name)
{
app_error_handler(0xDEADBEEF, line_num, p_file_name);
}
/**@brief Function for initializing the LEDs.
*
* @details Initializes all LEDs used by the application.
*/
static void leds_init(void)
{
bsp_board_init(BSP_INIT_LEDS);
}
/**@brief Function for handling Queued Write Module errors.
*
* @details A pointer to this function will be passed to each service which may need to inform the
* application about an error.
*
* @param[in] nrf_error Error code containing information about what went wrong.
*/
static void scan_evt_handler(scan_evt_t const * p_scan_evt)
{
ret_code_t err_code;
switch(p_scan_evt->scan_evt_id)
{
case NRF_BLE_SCAN_EVT_CONNECTING_ERROR:
{
err_code = p_scan_evt->params.connecting_err.err_code;
APP_ERROR_CHECK(err_code);
} break;
default:
break;
}
}
/**@brief Function for initializing the scanning and setting the filters. */
static void scan_init(void)
{
ret_code_t err_code;
nrf_ble_scan_init_t init_scan;
memset(&init_scan, 0, sizeof(init_scan));
init_scan.connect_if_match = true;
init_scan.conn_cfg_tag = APP_BLE_CONN_CFG_TAG;
err_code = nrf_ble_scan_init(&m_scan, &init_scan, scan_evt_handler);
APP_ERROR_CHECK(err_code);
err_code = nrf_ble_scan_filter_set(&m_scan, SCAN_UUID_FILTER, &m_nus_uuid);
APP_ERROR_CHECK(err_code);
err_code = nrf_ble_scan_filters_enable(&m_scan, NRF_BLE_SCAN_UUID_FILTER, false);
APP_ERROR_CHECK(err_code);
}
/**@brief Function for starting scanning. */
static void scan_start(void)
{
ret_code_t ret;
sd_ble_gap_scan_stop();
NRF_LOG_INFO("Start scanning for device name %s.", (uint32_t)m_target_periph_name);
ret = nrf_ble_scan_start(&m_scan);
APP_ERROR_CHECK(ret);
// Turn on the LED to signal scanning.
bsp_board_led_on(CENTRAL_SCANNING_LED);
}
static void ble_nus_chars_received_uart_print(uint8_t * p_data, uint16_t data_len)
{
ret_code_t ret_val;
NRF_LOG_DEBUG("Receiving data.");
NRF_LOG_HEXDUMP_DEBUG(p_data, data_len);
for (uint32_t i = 0; i < data_len; i++)
{
do
{
ret_val = app_uart_put(p_data[i]);
if ((ret_val != NRF_SUCCESS) && (ret_val != NRF_ERROR_BUSY))
{
NRF_LOG_ERROR("app_uart_put failed for index 0x%04x.", i);
APP_ERROR_CHECK(ret_val);
}
} while (ret_val == NRF_ERROR_BUSY);
}
if (p_data[data_len-1] == '\r')
{
while (app_uart_put('\n') == NRF_ERROR_BUSY);
}
/*
*It can be used later, so it wasn't removed.
if (ECHOBACK_BLE_UART_DATA)
{
// Send data back to the peripheral.
do
{
for (uint32_t i = 0; i < NRF_SDH_BLE_CENTRAL_LINK_COUNT; i++)
{
ret_val = ble_nus_c_string_send(&m_ble_nus_c, p_data, data_len);
if ((ret_val != NRF_SUCCESS) && (ret_val != NRF_ERROR_BUSY))
{
NRF_LOG_ERROR("Failed sending NUS message. Error 0x%x. ", ret_val);
APP_ERROR_CHECK(ret_val);
}
}
} while (ret_val == NRF_ERROR_BUSY);
}
*/
}
/**@brief Function for handling app_uart events.
*
* @details This function receives a single character from the app_uart module and appends it to
* a string. The string is sent over BLE when the last character received is a
* 'new line' '\n' (hex 0x0A) or if the string reaches the maximum data length.
*/
void uart_event_handle(app_uart_evt_t * p_event)
{
static uint8_t data_array[BLE_NUS_MAX_DATA_LEN];
static uint16_t index = 0;
uint32_t ret_val;
switch (p_event->evt_type)
{
/**@snippet [Handling data from UART] */
case APP_UART_DATA_READY:
UNUSED_VARIABLE(app_uart_get(&data_array[index]));
index++;
if ((data_array[index - 1] == '\n') || (index >= (m_ble_nus_max_data_len)))
{
NRF_LOG_DEBUG("Ready to send data over BLE NUS");
NRF_LOG_HEXDUMP_DEBUG(data_array, index);
do
{
ret_val = ble_nus_c_string_send(&m_ble_nus_c, data_array, index);
if ( (ret_val != NRF_ERROR_INVALID_STATE) && (ret_val != NRF_ERROR_RESOURCES) )
{
APP_ERROR_CHECK(ret_val);
}
} while (ret_val == NRF_ERROR_RESOURCES);
index = 0;
}
break;
/**@snippet [Handling data from UART] */
case APP_UART_COMMUNICATION_ERROR:
NRF_LOG_ERROR("Communication error occurred while handling UART.");
APP_ERROR_HANDLER(p_event->data.error_communication);
break;
case APP_UART_FIFO_ERROR:
NRF_LOG_ERROR("Error occurred in FIFO module used by UART.");
APP_ERROR_HANDLER(p_event->data.error_code);
break;
default:
break;
}
}
/**@brief Callback handling Nordic UART Service (NUS) client events.
*
* @details This function is called to notify the application of NUS client events.
*
* @param[in] p_ble_nus_c NUS client handle. This identifies the NUS client.
* @param[in] p_ble_nus_evt Pointer to the NUS client event.
*/
/**@snippet [Handling events from the ble_nus_c module] */
static void ble_nus_c_evt_handler(ble_nus_c_t * p_ble_nus_c, ble_nus_c_evt_t const * p_ble_nus_evt)
{
ret_code_t err_code;
switch (p_ble_nus_evt->evt_type)
{
case BLE_NUS_C_EVT_DISCOVERY_COMPLETE:
NRF_LOG_INFO("Discovery complete.");
err_code = ble_nus_c_tx_notif_enable(p_ble_nus_c);
APP_ERROR_CHECK(err_code);
NRF_LOG_INFO("Connected to device with Nordic UART Service.");
if(err_code != NRF_ERROR_BUSY)
{
APP_ERROR_CHECK(err_code);
}
break;
case BLE_NUS_C_EVT_NUS_TX_EVT:
printf(p_ble_nus_evt->p_data);
break;
case BLE_NUS_C_EVT_DISCONNECTED:
NRF_LOG_INFO("Disconnected.");
scan_start();
break;
}
}
/**
* @brief Function for handling shutdown events.
*
* @param[in] event Shutdown type.
*/
static bool shutdown_handler(nrf_pwr_mgmt_evt_t event)
{
ret_code_t err_code;
err_code = bsp_indication_set(BSP_INDICATE_IDLE);
APP_ERROR_CHECK(err_code);
switch (event)
{
case NRF_PWR_MGMT_EVT_PREPARE_WAKEUP:
// Prepare wakeup buttons.
err_code = bsp_btn_ble_sleep_mode_prepare();
APP_ERROR_CHECK(err_code);
break;
default:
break;
}
return true;
}
NRF_PWR_MGMT_HANDLER_REGISTER(shutdown_handler, APP_SHUTDOWN_HANDLER_PRIORITY);
/**@brief Function for initializing nRF uart service that will be used by ble.
*/
static void nus_c_init(void)
{
ret_code_t err_code;
ble_nus_c_init_t init;
init.evt_handler = ble_nus_c_evt_handler;
for (m_ble_nus_c_count = 0; m_ble_nus_c_count < NRF_SDH_BLE_TOTAL_LINK_COUNT; m_ble_nus_c_count++)
{
err_code = ble_nus_c_init(&m_ble_nus_c[m_ble_nus_c_count], &init);
APP_ERROR_CHECK(err_code);
}
m_ble_nus_c_count = 0;
}
/**@brief Function for handling BLE events.
*
* @param[in] p_ble_evt Bluetooth stack event.
* @param[in] p_context Unused.
*/
static void ble_evt_handler(ble_evt_t const * p_ble_evt, void * p_context)
{
ret_code_t err_code;
// For readability.
ble_gap_evt_t const * p_gap_evt = &p_ble_evt->evt.gap_evt;
switch (p_ble_evt->header.evt_id)
{
// Upon connection, check which peripheral is connected, initiate DB
// discovery, update LEDs status, and resume scanning, if necessary.
case BLE_GAP_EVT_CONNECTED:
{
NRF_LOG_INFO("Connection 0x%x established, starting DB discovery.",
p_gap_evt->conn_handle);
APP_ERROR_CHECK_BOOL(p_gap_evt->conn_handle < NRF_SDH_BLE_CENTRAL_LINK_COUNT);
err_code = ble_nus_c_handles_assign(&m_ble_nus_c[p_gap_evt->conn_handle], p_gap_evt->conn_handle, NULL);
APP_ERROR_CHECK(err_code);
err_code = ble_db_discovery_start(&m_db_disc[p_gap_evt->conn_handle],
p_gap_evt->conn_handle);
if (err_code != NRF_ERROR_BUSY)
{
APP_ERROR_CHECK(err_code);
}
// Update LEDs status and check whether it is needed to look for more
// peripherals to connect to.
bsp_board_led_on(CENTRAL_CONNECTED_LED);
if (ble_conn_state_central_conn_count() == NRF_SDH_BLE_CENTRAL_LINK_COUNT)
{
bsp_board_led_off(CENTRAL_SCANNING_LED);
}
else
{
// Resume scanning.
bsp_board_led_on(CENTRAL_SCANNING_LED);
scan_start();
}
} break; // BLE_GAP_EVT_CONNECTED
// Upon disconnection, reset the connection handle of the peer that disconnected, update
// the LEDs status and start scanning again.
case BLE_GAP_EVT_DISCONNECTED:
{
NRF_LOG_INFO("LBS central link 0x%x disconnected (reason: 0x%x)",
p_gap_evt->conn_handle,
p_gap_evt->params.disconnected.reason);
if (ble_conn_state_central_conn_count() == 0)
{
// Turn off the LED that indicates the connection.
bsp_board_led_off(CENTRAL_CONNECTED_LED);
}
// Start scanning.
scan_start();
// Turn on the LED for indicating scanning.
bsp_board_led_on(CENTRAL_SCANNING_LED);
} break;
case BLE_GAP_EVT_TIMEOUT:
{
// Timeout for scanning is not specified, so only the connection requests can time out.
if (p_gap_evt->params.timeout.src == BLE_GAP_TIMEOUT_SRC_CONN)
{
scan_start();
NRF_LOG_DEBUG("Connection request timed out.");
}
} break;
case BLE_GAP_EVT_CONN_PARAM_UPDATE_REQUEST:
{
NRF_LOG_DEBUG("BLE_GAP_EVT_CONN_PARAM_UPDATE_REQUEST.");
// Accept parameters requested by peer.
err_code = sd_ble_gap_conn_param_update(p_gap_evt->conn_handle,
&p_gap_evt->params.conn_param_update_request.conn_params);
APP_ERROR_CHECK(err_code);
} break;
case BLE_GAP_EVT_PHY_UPDATE_REQUEST:
{
NRF_LOG_DEBUG("PHY update request.");
ble_gap_phys_t const phys =
{
.rx_phys = BLE_GAP_PHY_AUTO,
.tx_phys = BLE_GAP_PHY_AUTO,
};
err_code = sd_ble_gap_phy_update(p_ble_evt->evt.gap_evt.conn_handle, &phys);
APP_ERROR_CHECK(err_code);
} break;
case BLE_GATTC_EVT_TIMEOUT:
{
// Disconnect on GATT client timeout event.
NRF_LOG_DEBUG("GATT client timeout.");
err_code = sd_ble_gap_disconnect(p_ble_evt->evt.gattc_evt.conn_handle,
BLE_HCI_REMOTE_USER_TERMINATED_CONNECTION);
APP_ERROR_CHECK(err_code);
} break;
case BLE_GATTS_EVT_TIMEOUT:
{
// Disconnect on GATT server timeout event.
NRF_LOG_DEBUG("GATT server timeout.");
err_code = sd_ble_gap_disconnect(p_ble_evt->evt.gatts_evt.conn_handle,
BLE_HCI_REMOTE_USER_TERMINATED_CONNECTION);
APP_ERROR_CHECK(err_code);
} break;
default:
// No implementation needed.
break;
}
}
/**@brief Function for initializing the BLE stack.
*
* @details Initializes the SoftDevice and the BLE event interrupts.
*/
static void ble_stack_init(void)
{
ret_code_t err_code;
err_code = nrf_sdh_enable_request();
APP_ERROR_CHECK(err_code);
// Configure the BLE stack using the default settings.
// Fetch the start address of the application RAM.
uint32_t ram_start = 0;
err_code = nrf_sdh_ble_default_cfg_set(APP_BLE_CONN_CFG_TAG, &ram_start);
APP_ERROR_CHECK(err_code);
// Enable BLE stack.
err_code = nrf_sdh_ble_enable(&ram_start);
APP_ERROR_CHECK(err_code);
// Register a handler for BLE events.
NRF_SDH_BLE_OBSERVER(m_ble_observer, APP_BLE_OBSERVER_PRIO, ble_evt_handler, NULL);
}
/**@brief Function for handling database discovery events.
*
* @details This function is a callback function to handle events from the database discovery module.
* Depending on the UUIDs that are discovered, this function forwards the events
* to their respective services.
*
* @param[in] p_event Pointer to the database discovery event.
*/
static void db_disc_handler(ble_db_discovery_evt_t * p_evt)
{
ble_nus_c_on_db_disc_evt(&m_ble_nus_c[p_evt->conn_handle], p_evt);
}
/** @brief Database discovery initialization.
*/
static void db_discovery_init(void)
{
ret_code_t err_code = ble_db_discovery_init(db_disc_handler);
APP_ERROR_CHECK(err_code);
}
/**@brief Function for initializing power management.
*/
static void power_management_init(void)
{
ret_code_t err_code;
err_code = nrf_pwr_mgmt_init();
APP_ERROR_CHECK(err_code);
}
/**@brief Function for handling the idle state (main loop).
*
* @details This function handles any pending log operations, then sleeps until the next event occurs.
*/
static void idle_state_handle(void)
{
if (NRF_LOG_PROCESS() == false)
{
nrf_pwr_mgmt_run();
}
}
/** @brief Function for initializing the log module.
*/
static void log_init(void)
{
ret_code_t err_code = NRF_LOG_INIT(NULL);
APP_ERROR_CHECK(err_code);
NRF_LOG_DEFAULT_BACKENDS_INIT();
}
/** @brief Function for initializing the timer.
*/
static void timer_init(void)
{
ret_code_t err_code = app_timer_init();
APP_ERROR_CHECK(err_code);
}
/**@brief Application main function.
*/
void timer_handler(nrf_timer_event_t event_type, void * p_context)
{
}
/**@brief Function for initializing the GATT module.
*/
void gatt_evt_handler(nrf_ble_gatt_t * p_gatt, nrf_ble_gatt_evt_t const * p_evt)
{
if (p_evt->evt_id == NRF_BLE_GATT_EVT_ATT_MTU_UPDATED)
{
NRF_LOG_INFO("ATT MTU exchange completed.");
m_ble_nus_max_data_len = p_evt->params.att_mtu_effective - OPCODE_LENGTH - HANDLE_LENGTH;
NRF_LOG_INFO("Ble NUS max data length set to 0x%X(%d)", m_ble_nus_max_data_len, m_ble_nus_max_data_len);
}
}
/**@brief Function for initializing the GATT library. */
void gatt_init(void)
{
ret_code_t err_code;
err_code = nrf_ble_gatt_init(&m_gatt, gatt_evt_handler);
APP_ERROR_CHECK(err_code);
err_code = nrf_ble_gatt_att_mtu_central_set(&m_gatt, NRF_SDH_BLE_GATT_MAX_MTU_SIZE);
APP_ERROR_CHECK(err_code);
}
/**@snippet [Handling the data received over UART] */
/**@brief Function for initializing the UART module.
*/
static void uart_init(void)
{
ret_code_t err_code;
app_uart_comm_params_t const comm_params =
{
.rx_pin_no = RX_PIN_NUMBER,
.tx_pin_no = TX_PIN_NUMBER,
.rts_pin_no = RTS_PIN_NUMBER,
.cts_pin_no = CTS_PIN_NUMBER,
.flow_control = APP_UART_FLOW_CONTROL_DISABLED,
.use_parity = false,
.baud_rate = UART_BAUDRATE_BAUDRATE_Baud115200
};
APP_UART_FIFO_INIT(&comm_params,
UART_RX_BUF_SIZE,
UART_TX_BUF_SIZE,
uart_event_handle,
APP_IRQ_PRIORITY_LOWEST,
err_code);
APP_ERROR_CHECK(err_code);
}
/**@snippet [UART Initialization] */
void fft_generate_samples(m_fft_input_f32 * p_input,
float * input_data)
{
#ifdef ACCEL_FFT_PRINT
// Real part.
p_input->x_input[accel_counter*2] = input_data[0]-calib_offset[0];
p_input->y_input[accel_counter*2] = input_data[1]-calib_offset[1];
p_input->z_input[accel_counter*2] = input_data[2]-calib_offset[2];
// printf("%lf\n", p_input[accel_counter*2]);
// Img part.
p_input->x_input[accel_counter*2 + 1] = 0;
p_input->y_input[accel_counter*2 + 1] = 0;
p_input->z_input[accel_counter*2 + 1] = 0;
#endif
#ifdef SOUND_FFT_PRINT
p_input->sound_input[sound_counter*2] = *input_data;
p_input->sound_input[sound_counter*2 + 1] = 0;
#endif
}
/**@brief Function for initializing the sampling event of saadc(Successive approximation analog-to-digital converter)
*/
void saadc_sampling_event_init(void)
{
ret_code_t err_code;
err_code = nrf_drv_ppi_init();
APP_ERROR_CHECK(err_code);
nrf_drv_timer_config_t timer_cfg = NRF_DRV_TIMER_DEFAULT_CONFIG;
timer_cfg.frequency = NRF_TIMER_FREQ_4MHz;
err_code = nrf_drv_timer_init(&m_timer, &timer_cfg, timer_handler);
APP_ERROR_CHECK(err_code);
/* setup m_timer for compare event every 400ms */
uint32_t ticks = nrf_drv_timer_ms_to_ticks(&m_timer, SAADC_SAMPLE_RATE);
nrf_drv_timer_extended_compare(&m_timer,
NRF_TIMER_CC_CHANNEL2,
ticks,
NRF_TIMER_SHORT_COMPARE2_CLEAR_MASK,
false);
nrf_drv_timer_enable(&m_timer);
uint32_t timer_compare_event_addr = nrf_drv_timer_compare_event_address_get(&m_timer,
NRF_TIMER_CC_CHANNEL2);
uint32_t saadc_sample_task_addr = nrf_drv_saadc_sample_task_get();
/* setup ppi channel so that timer compare event is triggering sample task in SAADC */
err_code = nrf_drv_ppi_channel_alloc(&m_ppi_channel);
APP_ERROR_CHECK(err_code);
err_code = nrf_drv_ppi_channel_assign(m_ppi_channel,
timer_compare_event_addr,
saadc_sample_task_addr);
APP_ERROR_CHECK(err_code);
}
/**@brief Function for enabling sampling event of saadc
*/
void saadc_sampling_event_enable(void)
{
ret_code_t err_code = nrf_drv_ppi_channel_enable(m_ppi_channel);
APP_ERROR_CHECK(err_code);
}
/**@brief Function for handling the event of saadc sampling result
*
* @param[in] event Event generated by analog-to-digital convert.
*/
void saadc_callback(nrf_drv_saadc_evt_t const * p_event)
{
if (p_event->type == NRF_DRV_SAADC_EVT_DONE)
{
ret_code_t err_code;
nrf_saadc_value_t bat_result;
uint16_t batt_lvl_in_milli_volts;
uint8_t percentage_batt_lvl;
float sound_value;
float* sound_temp;
char saadc_temp[30];
static uint8_t nus_temp2[30];
err_code = nrf_drv_saadc_buffer_convert(p_event->data.done.p_buffer, SAMPLES_IN_BUFFER);
APP_ERROR_CHECK(err_code);
bat_result = p_event->data.done.p_buffer[BAT_CHANNEL];
batt_lvl_in_milli_volts = ADC_RESULT_IN_MILLI_VOLTS(bat_result) +
DIODE_FWD_VOLT_DROP_MILLIVOLTS;
percentage_batt_lvl = battery_level_in_percent(batt_lvl_in_milli_volts);
// sprintf(saadc_temp, "master : %d %d %d %d", p_event->data.done.p_buffer[FLAME_CHANNEL], p_event->data.done.p_buffer[SOUND_CHANNEL], p_event->data.done.p_buffer[HUMID_CHANNEL], percentage_batt_lvl);
// printf("%s\n", saadc_temp);
sound_value = p_event->data.done.p_buffer[SOUND_CHANNEL] * 0.6 / ADC_RES_10BIT;
sound_temp = &sound_value;
#ifdef SOUND_FFT_PRINT
fft_generate_samples(&fft_input, sound_temp);
sound_counter++;
#endif
}
}
/**@brief Function for initializing the saadc
*/
void saadc_init(void)
{
ret_code_t err_code;
nrf_drv_saadc_config_t saadc_config = NRF_DRV_SAADC_DEFAULT_CONFIG;
saadc_config.resolution = NRF_SAADC_RESOLUTION_10BIT;
ch_config_flame.gain = NRF_SAADC_GAIN1_4;
ch_config_flame.reference = NRF_SAADC_REFERENCE_VDD4;
ch_config_sound.gain = NRF_SAADC_GAIN1_6;
ch_config_sound.reference = NRF_SAADC_REFERENCE_INTERNAL;
ch_config_sound.burst = NRF_SAADC_BURST_ENABLED;
ch_config_humid.gain = NRF_SAADC_GAIN1_4;
ch_config_humid.reference = NRF_SAADC_REFERENCE_VDD4;
ch_config_bat.gain = NRF_SAADC_GAIN1_4;
ch_config_bat.reference = NRF_SAADC_REFERENCE_VDD4;
err_code = nrf_drv_saadc_init(&saadc_config, saadc_callback);
APP_ERROR_CHECK(err_code);
err_code = nrf_drv_saadc_channel_init(FLAME_CHANNEL, &ch_config_flame);
APP_ERROR_CHECK(err_code);
err_code = nrf_drv_saadc_channel_init(SOUND_CHANNEL, &ch_config_sound);
APP_ERROR_CHECK(err_code);
err_code = nrf_drv_saadc_channel_init(HUMID_CHANNEL, &ch_config_humid);
APP_ERROR_CHECK(err_code);
err_code = nrf_drv_saadc_channel_init(BAT_CHANNEL, &ch_config_bat);
APP_ERROR_CHECK(err_code);
err_code = nrfx_saadc_buffer_convert(m_buffer_pool[0], SAMPLES_IN_BUFFER);
APP_ERROR_CHECK(err_code);
err_code = nrfx_saadc_buffer_convert(m_buffer_pool[1], SAMPLES_IN_BUFFER);
APP_ERROR_CHECK(err_code);
}
/**
* @brief Function for processing generated sine wave samples.
* @param[in] p_input Pointer to input data array with complex number samples in time domain.
* @param[in] p_input_struct Pointer to cfft instance structure describing input data.
* @param[out] p_output Pointer to processed data (bins) array in frequency domain.
* @param[in] output_size Processed data array size.
*/
void fft_process(m_fft_input_f32 * p_input,
const arm_cfft_instance_f32 * p_input_struct,
m_fft_output_f32 * p_output,
uint16_t output_size)
{
#ifdef ACCEL_FFT_PRINT
// Use CFFT module to process the data.
arm_cfft_f32(p_input_struct, p_input->x_input, m_ifft_flag, m_do_bit_reverse);
// Calculate the magnitude at each bin using Complex Magnitude Module function.
arm_cmplx_mag_f32(p_input->x_input, p_output->x_output, output_size);
arm_cfft_f32(p_input_struct, p_input->y_input, m_ifft_flag, m_do_bit_reverse);
arm_cmplx_mag_f32(p_input->y_input, p_output->y_output, output_size);
arm_cfft_f32(p_input_struct, p_input->z_input, m_ifft_flag, m_do_bit_reverse);
arm_cmplx_mag_f32(p_input->z_input, p_output->z_output, output_size);
#endif
#ifdef SOUND_FFT_PRINT
arm_cfft_f32(p_input_struct, p_input->sound_input, m_ifft_flag, m_do_bit_reverse);
arm_cmplx_mag_f32(p_input->sound_input, p_output->sound_output, output_size);
#endif
}
#ifdef FPU_INTERRUPT_MODE
/**
* @brief FPU Interrupt handler. Clearing exception flag at the stack.
*
* Function clears exception flag in FPSCR register and at the stack. During interrupt handler
* execution FPU registers might be copied to the stack (see lazy stacking option) and
* it is necessary to clear data at the stack which will be recovered in the return from
* interrupt handling.
*/
void FPU_IRQHandler(void)
{
// Prepare pointer to stack address with pushed FPSCR register.
uint32_t * fpscr = (uint32_t * )(FPU->FPCAR + FPU_FPSCR_REG_STACK_OFF);
// Execute FPU instruction to activate lazy stacking.
(void)__get_FPSCR();
// Clear flags in stacked FPSCR register.
*fpscr = *fpscr & ~(FPU_EXCEPTION_MASK);
}
#endif
/**
* @brief Function for drawing line with given width.
* @param[in] line_width Line width.
*/
static void draw_line(uint16_t line_width)
{
uint32_t i;
char line[line_width + 1];
for (i = 0; i < line_width; i++)
{
line[i] = '-';
}
line[line_width] = 0;
NRF_LOG_RAW_INFO("%s\r\n", nrf_log_push(line));
}
/**
* @brief Function for drawing line and processed data informations.
* @param[in] input_sine_freq Input sine wave frequency.
* @param[in] is_noisy Flag if data is noisy.
* @param[in] chart_width Drawing chart height.
*/
static void draw_fft_header(float32_t input_sine_freq, bool is_noisy)
{
NRF_LOG_RAW_INFO("Input: sine %uHz, noise: %s.\r\n", (uint16_t)input_sine_freq,
(uint32_t)((is_noisy == true) ? "yes" : "no"));
}
/**
* @brief Function for drawing ASCII data processed by FFT function.
* @param[in] p_input_data Pointer to FFT data array.
* @param[in] data_size FFT array size.
* @param[in] chart_height Drawing chart height.
*/
void draw_fft_data(m_fft_output_f32 * p_input_data, uint16_t data_size, uint16_t chart_height)
{
uint32_t graph_y, graph_x;
float32_t curr_drawing_val;
float32_t curr_percent;
float32_t max_value;
uint32_t max_val_index;
char tmp_str[data_size + 1];
// Search FFT max value in input array.
arm_max_f32(p_input_data->OUTPUT_PORT, data_size, &max_value, &max_val_index);
// Draw graph. Put space if number is less than currently processed, put '|' character otherwise.
for (graph_y = chart_height; graph_y > 0; graph_y--)
{
curr_percent = ((graph_y - 1) / (chart_height * 1.f));
curr_drawing_val = max_value * curr_percent;
for (graph_x = 0; graph_x < data_size; graph_x++)
{
if (p_input_data->OUTPUT_PORT[graph_x] > curr_drawing_val)
{
tmp_str[graph_x] = '|';
} else
{
tmp_str[graph_x] = ' ';
}
}
tmp_str[data_size] = 0;
NRF_LOG_RAW_INFO("%s\r\n", NRF_LOG_PUSH(tmp_str));
NRF_LOG_FLUSH();
}
draw_line(data_size);
}
/**@brief Function for TWI (with transaction manager and twi_sensor) initialization.
*/
static void twi_init(void)
{
uint32_t err_code;
const nrf_drv_twi_config_t ii_config = {
.scl = ARDUINO_SCL_PIN,
.sda = ARDUINO_SDA_PIN,
.frequency = NRF_DRV_TWI_FREQ_400K,
.interrupt_priority = APP_IRQ_PRIORITY_HIGHEST,
.clear_bus_init = false
};
err_code = nrf_twi_mngr_init(&m_nrf_twi_mngr, &ii_config);
APP_ERROR_CHECK(err_code);
err_code = nrf_twi_sensor_init(&m_nrf_twi_sensor);
APP_ERROR_CHECK(err_code);
}
/**@brief Function for TWI Reset (with transaction manager and twi_sensor) reset.
*/
static void twi_reset(void)
{
uint32_t err_code;
const nrf_drv_twi_config_t ii_config = {
.scl = ARDUINO_SCL_PIN,
.sda = ARDUINO_SDA_PIN,
.frequency = NRF_DRV_TWI_FREQ_400K,
.interrupt_priority = APP_IRQ_PRIORITY_HIGHEST,
.clear_bus_init = true
};
nrf_twi_mngr_uninit(&m_nrf_twi_mngr);
err_code = nrf_twi_mngr_init(&m_nrf_twi_mngr, &ii_config);
APP_ERROR_CHECK(err_code);
err_code = nrf_twi_sensor_init(&m_nrf_twi_sensor);
APP_ERROR_CHECK(err_code);
}
/**@brief Function for converting decimal to 62 numtype notation.
*/
char* dto62(int decimal)
{
static char hexabindecimal[20] = {0, };
static char minus_hexabindecimal[20];
int position = 0;
int minus_flag = 0;
while (1)
{
if(decimal<0)
{
minus_flag=1;
decimal=decimal*-1;
}
int mod = decimal % 62;
if (mod < 10)
{
hexabindecimal[position] = 48 + mod;
}
else if(mod < 36)
{
hexabindecimal[position] = 65 + (mod - 10);
}
else
{
hexabindecimal[position] = 97 + (mod - 36);
}
decimal = decimal / 62;
position++;
if (decimal == 0) break;
}
reverseString(hexabindecimal);
if(minus_flag==1)
{
sprintf(minus_hexabindecimal,"-%s",hexabindecimal);
return minus_hexabindecimal;
}
return hexabindecimal;
}
/**@brief Function for connection with the iis2dlpc_read_reg function and nrf52840 SDK.
* @param[out] return Should be 0.
*/
int32_t platform_read(void *handle, uint8_t reg, uint8_t *bufp, uint16_t len)
{
nrf_twi_sensor_reg_read(&m_nrf_twi_sensor, II_ADDR, reg, NULL, bufp, len);
nrf_delay_us(500);
NRF_LOG_FLUSH();
return 0;
}
/**@brief Function for connection with the iis2dlpc_write_reg function and nrf52840 SDK.
* @param[out] return Should be 0.
*/
int32_t platform_write(void *handle, uint8_t reg, uint8_t *bufp, uint16_t len)
{
nrf_twi_sensor_reg_write(&m_nrf_twi_sensor, II_ADDR, reg, bufp, len);
nrf_delay_us(500);
NRF_LOG_FLUSH();
return 0;
}
/**@brief Function for initializing iis2dlpc sensor.
* @details This function sets states of the iis2dlpc sensor and can affect
* the sensitivity of the sensor.
* If you failed to get device ID, you can push reset button to solve the issue easily
*/
void platform_init(void)
{
twi_init();
dev_ctx.write_reg = platform_write;
dev_ctx.read_reg = platform_read;
dev_ctx.handle = NULL;
iis2dlpc_device_id_get(&dev_ctx, &whoamI);
while(whoamI != IIS2DLPC_ID)
{
printf("\r\ndevice_id_get failed\r\n");
twi_reset();
iis2dlpc_device_id_get(&dev_ctx, &whoamI);
}
iis2dlpc_reset_set(&dev_ctx, PROPERTY_ENABLE);
do {
iis2dlpc_reset_get(&dev_ctx, &rst);
} while (rst);
iis2dlpc_block_data_update_set(&dev_ctx, PROPERTY_ENABLE);
iis2dlpc_full_scale_set(&dev_ctx, IIS2DLPC_16g);
iis2dlpc_filter_path_set(&dev_ctx, IIS2DLPC_LPF_ON_OUT);
iis2dlpc_filter_bandwidth_set(&dev_ctx, IIS2DLPC_ODR_DIV_20);
iis2dlpc_power_mode_set(&dev_ctx, IIS2DLPC_HIGH_PERFORMANCE_LOW_NOISE);
iis2dlpc_data_rate_set(&dev_ctx, IIS2DLPC_XL_ODR_1k6Hz);
printf("\r\nall settings are completed\r\n");
}
void fft_calibration(void)
{
static float sum_buffer[3];
for(int calib_count = 0; calib_count < 255; calib_count++)
{
uint8_t reg;
iis2dlpc_flag_data_ready_get(&dev_ctx, ®);
if(reg)
{
memset(data_raw_acceleration.u8bit, 0x00, 3 * sizeof(int16_t));
iis2dlpc_acceleration_raw_get(&dev_ctx, data_raw_acceleration.u8bit);
for(int i = 0; i < 3; i++)
{
sum_buffer[i] += iis2dlpc_from_fs2_to_mg(data_raw_acceleration.i16bit[i]);
nrf_delay_us(10);
}
}
else calib_count--;
}
for(int j = 0; j < 3; j++)
{
calib_offset[j] = sum_buffer[j]/256;
}
}
/**@brief Function for activating main function of iis2dlpc sensor.
* @details This function takes raw data from the sensor register and transmits it to the MCU,
* converts the data into readable and outputs it.
* If the state of the sensor is not ready to get new raw data, initialize all the
* variables' value in this function every time. (except with current/previous_value)
* @param[out] return can be anything.
*/
int iirun(void)
{
uint8_t reg;
iis2dlpc_flag_data_ready_get(&dev_ctx, ®);
if(reg)
{
memset(data_raw_acceleration.u8bit, 0x00, 3 * sizeof(int16_t));
iis2dlpc_acceleration_raw_get(&dev_ctx, data_raw_acceleration.u8bit);
acceleration_mg[0] = iis2dlpc_from_fs2_to_mg(data_raw_acceleration.i16bit[0]);
acceleration_mg[1] = iis2dlpc_from_fs2_to_mg(data_raw_acceleration.i16bit[1]);
acceleration_mg[2] = iis2dlpc_from_fs2_to_mg(data_raw_acceleration.i16bit[2]);
current_value[0] = acceleration_mg[0];
current_value[1] = acceleration_mg[1];
current_value[2] = acceleration_mg[2];
memcpy(difference0,dto62(current_value[0]-previous_value[0]),sizeof(dto62(current_value[0]-previous_value[0])));
memcpy(difference1,dto62(current_value[1]-previous_value[1]),sizeof(dto62(current_value[1]-previous_value[1])));
memcpy(difference2,dto62(current_value[2]-previous_value[2]),sizeof(dto62(current_value[2]-previous_value[2])));
memset(m_buffer, 0, sizeof(difference0)+sizeof(difference1)+sizeof(difference2)+3);
sprintf(m_buffer, "%s %s %s", difference0, difference1, difference2);
#ifdef ACCEL_FFT_PRINT
fft_generate_samples(&fft_input,
acceleration_mg);
accel_counter++;
if(accel_counter == FFT_TEST_OUT_SAMPLES_LEN)
{
fft_process(&fft_input,
&arm_cfft_sR_f32_len256,
&fft_output,
FFT_TEST_OUT_SAMPLES_LEN);
accel_counter = 0;
draw_fft_data(&fft_output, FFT_TEST_OUT_SAMPLES_LEN, GRAPH_WINDOW_HEIGHT);
nrf_delay_ms(1000);
}
#endif
NRF_LOG_FLUSH();
// printf(" %s\n\r",m_buffer);
}
else
{
memset(data_raw_acceleration.u8bit, 0x00, 3 * sizeof(int16_t));
}
memcpy(previous_value,current_value,sizeof(current_value));
memset(m_buffer, 0x00, DIFF_SIZE*3);
memset(difference0, 0x00, DIFF_SIZE);
memset(difference1, 0x00, DIFF_SIZE);
memset(difference2, 0x00, DIFF_SIZE);
return 0;
}
#ifdef TIMECHECK
void time_check(void)
{
if(counter == 1023)
{
stop=DWT->CYCCNT;
elapsed=stop-start;
printf("%d\n", elapsed);
counter = 0;
start = DWT->CYCCNT;
}
counter++;
}
#endif
int main(void)
{
bool noise = false;
float32_t sine_freq;
uint32_t err_code;
#ifdef FPU_INTERRUPT_MODE
// Enable FPU interrupt
NVIC_SetPriority(FPU_IRQn, APP_IRQ_PRIORITY_LOWEST);
NVIC_ClearPendingIRQ(FPU_IRQn);
NVIC_EnableIRQ(FPU_IRQn);
#endif
// Initialize.
log_init();
timer_init();
uart_init();
leds_init();
power_management_init();
ble_stack_init();
gatt_init();
db_discovery_init();
platform_init();
saadc_init();
saadc_sampling_event_init();
nus_c_init();
ble_conn_state_init();
scan_init();
// Start execution.
NRF_LOG_INFO("Multilink example started.");
// scan_start();
saadc_sampling_event_enable();
fft_calibration();
// cycle counter setup
#ifdef TIMECHECK
CoreDebug->DEMCR |= 0x1000000;
DWT->CYCCNT = 0;
DWT->CTRL |= 0x1;
#endif
for (;;)
{
iirun();
// nrf_delay_us(10);
idle_state_handle();
/* Clear FPSCR register and clear pending FPU interrupts. This code is base on
* nRF5x_release_notes.txt in documentation folder. It is necessary part of code when
* application using power saving mode and after handling FPU errors in polling mode.
*/
#ifdef SOUND_FFT_PRINT
if(sound_counter == FFT_TEST_COMP_SAMPLES_LEN-1UL)
{
nrf_saadc_disable();
sound_counter = 0;
fft_process(&fft_input,
&arm_cfft_sR_f32_len256,
&fft_output,
FFT_TEST_OUT_SAMPLES_LEN);
draw_fft_data(&fft_output, FFT_TEST_OUT_SAMPLES_LEN, GRAPH_WINDOW_HEIGHT);
// nrf_delay_ms(1000);
nrf_saadc_enable();
}
#endif
#ifndef FPU_INTERRUPT_MODE
__set_FPSCR(__get_FPSCR() & ~(FPU_EXCEPTION_MASK));
(void) __get_FPSCR();
NVIC_ClearPendingIRQ(FPU_IRQn);
#endif
}
}