This post is older than 2 years and might not be relevant anymore
More Info: Consider searching for newer posts

nRF5340 debug issues

  I have the nRF5340 PDK dev kit and am building the peripheral_lbs sample code using SES on a Windows 10 laptop.  I'm able to build the code successfully, but then I run into several issues -

  • When I connect my dev board to the computer, and in SES, go to Target -> Connect J-Link, I get an error message that says "Cannot connect to J-Link".
  • If I open up Segger Ozone, I am able to connect, reflash the board, and begin debugging.  However, I cannot get past the call to "err = bt_dev.drv->open()" in bt_enable(), which is called from main.c, #288.

  Any idea why SES does not want to connect to the dev kit?

  Any idea why I can't get past bt_enable() when using Ozone?

  Note - I am using the following -
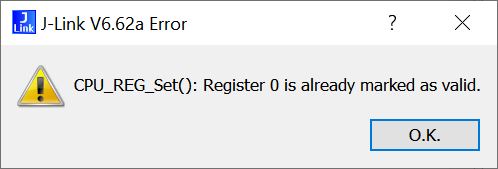
  • J-Link v6.62b
  • SES 4.42a, Build 2020021108.41362, Windows x64
  • Ozone v3.10d

  Thanks!

Brian

  • UPDATE - Tried this again today, and got different results.  Now, I am able to connect to the board with SES.  However, I'm unable to debug.  Here's the process I'm following - 

    1. Open the peripheral_lbs project in SES.
    2. Build the project - Build -> Rebuild Solution
    3. Start debugging - Target -> Go.  This causes an error dialog box pop-up from J-Link - 
    4. Click OK, which causes the code to get flashed onto the board.
    5. Click the Restart icon to get a valid value in the PC register (0x2c94).  This generates the following in the SES Output window -
      Reset: Reset device via AIRCR.SYSRESETREQ.
      Reading register 29 failed: Unspecified error
      Reading register 30 failed: Unspecified error
      Reading register 31 failed: Unspecified error
      Reading register 29 failed: Unspecified error
      Reading register 30 failed: Unspecified error
      Reading register 31 failed: Unspecified error
    6. I get the following output on my serial port - 
      Starting Bluetooth Peripheral LBS example
      I: 6 Sectors of 4096 bytes
      I: alloc wra: 0, ff0
      I: data wra: 0, 0

    7. Setting breakpoints at various points in main seems to stop the processor, but SES does not indicate where the processor is halted.  The PC always indicates 0x2c94 when hitting any of my breakpoints.

    If I switch to using Ozone to debug (Debug -> Debug with Ozone), I get different results - 

    1. Flash code onto board - Download and Reset Program.  PC is at start of main() (0x0AEC)
    2. I can set breakpoints, and the debugger shows where the breakpoint hits - unlike SES.
    3. I still cannot get past the call to bt_dev.drv->open(), which takes me to bt_rpmsg_platform_init().  Nothing in main after this call executes.

    Thanks!

  • There's a bug in the newest version of SES for Nordic :/ 

    I suggest you use the previous version of SES for nordic, or try Ozone or GDB for the time being. We've got a fix ready, but it will take some time to get a release ready. 

  • Thanks for the info haakonsh - I will use Ozone for the time being.

    Brian

Related