
Hello all,
I'm working on a prototype for a device that simultaneously scans and advertises in certain cases. I have been able to do everything so far except scan by copying or merging various examples from the SDK, but I'm running into a hard fault whenever I try to start scanning. Some details about the development environment:
- Nordic PCA10056 official devkit (v1.1.0, 2019.42) with nRF52840
- SEGGER Embedded Studio v4.52a running on MacOS
- SDK v16.0.0
- SoftDevice s140 v7.0.1
I am able to open, compile and successfully run the ble_app_att_mtu_throughput_pca10056_s140 example project in the /examples/ble_central_and_peripheral/experimental folder, which suggests that there is nothing broken about the hardware or the SDK/IDE combo. The problem is clearly somewhere in my project configuration or source code.
I have compared the emProject definition file, linker XML definition, the sdk_config.h header, and the main.c code dealing with the scan module initialization and usage from the example. But no matter what I imitate or directly copy over, my project always fails when I try to start scanning. I've enabled the hard fault handler implementation from SDK 16, so I'm able to get log details out the debug UART (as well as examine registers directly in SES).
My project has the following potentially relevant modules/libraries/drivers enabled:
- TWI0 (no DMA)
- SPI1 (no DMA)
- App timer (V2)
- Scheduler with pause (not currently used)
- Peer manager
- GATT server
- BLE advertising
- Flash device storage
- RTC2
- Connection parameters (no connections attempted at this point)
- UART debug logging (no RTT)
I've tried disabling the timer, scheduler, peer manager, connection parameters, GATT server, flash device storage, and even BLE advertising to see if it would help, but the problem is always the same. As soon as I try to start scanning, I get a hard fault where the program counter jumps to 0x00000A60. I've tried to start scanning immediately after the initialization procedure as well as five seconds afterwards; same behavior. Here's the debug output showing the hard fault:
<info> app: ================================================================
<info> app: App initializing
<info> app: BLE stack started with RAM start = 0x20008000
<info> app: App initialized
<info> app: Tick @ 1
<info> app: Tick @ 2
<info> app: Tick @ 3
<info> app: Tick @ 4
<info> app: Tick @ 5
<error> hardfault: HARD FAULT at 0x00000000
<error> hardfault:   R0:  0x2003FD24  R1:  0x2000AD2C  R2:  0x00000000  R3:  0x0003622C
<error> hardfault:   R12: 0x2003FCDC  LR:  0x00032C2B  PSR: 0x20000026
<error> hardfault: Cause: The processor has attempted to execute an instruction that makes illegal use of the EPSR.
Here are screenshots showing SES disassembly and register detail when the execution halts (this is shown immediately before I press F5 once to generate the hard fault debug details above, so I figured this is the most accurate set of register contents):
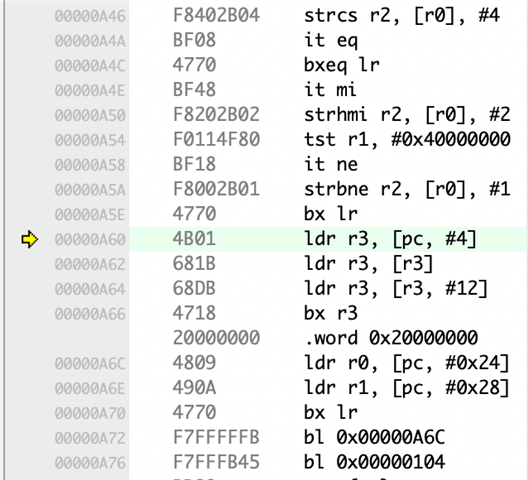
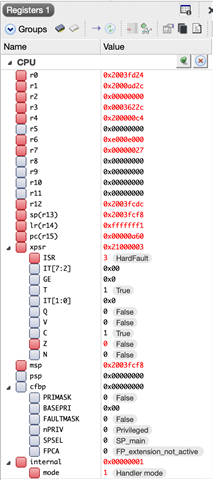
I've tried adjusting the RAM start/size in case I'm running out of stack space, but anywhere from 0x3000 to 0x8000 bytes yields the same exact behavior. The fact that the fault debug details show the PC at 0x00000000 doesn't make sense to me. I've tried combing through the various hard-fault-related forum posts to decode what could be causing this issue, but I'm at a loss.
Does anyone have any idea what is to blame here, or what I might do to find out?
Thanks!
