Hello,
This is regarding the problem faced while flash and debug the nrf9160 feather,
1) Build and flash using the west
we are using nrf 9160 feather so it has a different technique to compile and flash the code into it.
Please check the below link for how to compile and flash the code using west.(https://docs.jaredwolff.com/nrf9160-programming-and-debugging.html)
To understand I tried to compile and flash the blinky code. and it worked properly.
Then I tried to compile and flash GPS code with the same process but I got the error.
https://imgur.com/undefined (link of error image)
(https://docs.jaredwolff.com/nrf9160-agps-sample.html). I am enclosing the photo of the error. (file name is GPS error)
The question is I used the same process to flash both the code but got an error in the GPS code.
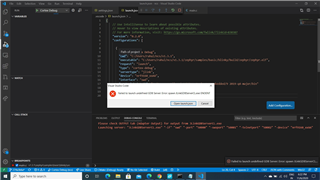
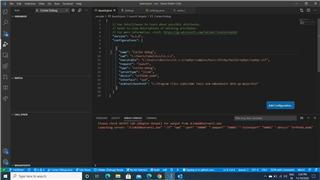
2) debug the code using visual code
As we are designing our firmware to load and debug the code we have to connect to visual code.
The Process is explained in the below Link. To understand the process I was using the blinky sample code.
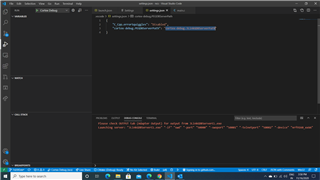
I followed all the steps mentioned in the documentation but at step 8 where we compile the code in visual code, I am getting an error. (Enclosed - file name is visual code error)

I don't know what needs to change to resolve the error.
Let me know if you can help me out to resolve the above error.
With Regards,
Rahul Kidecha