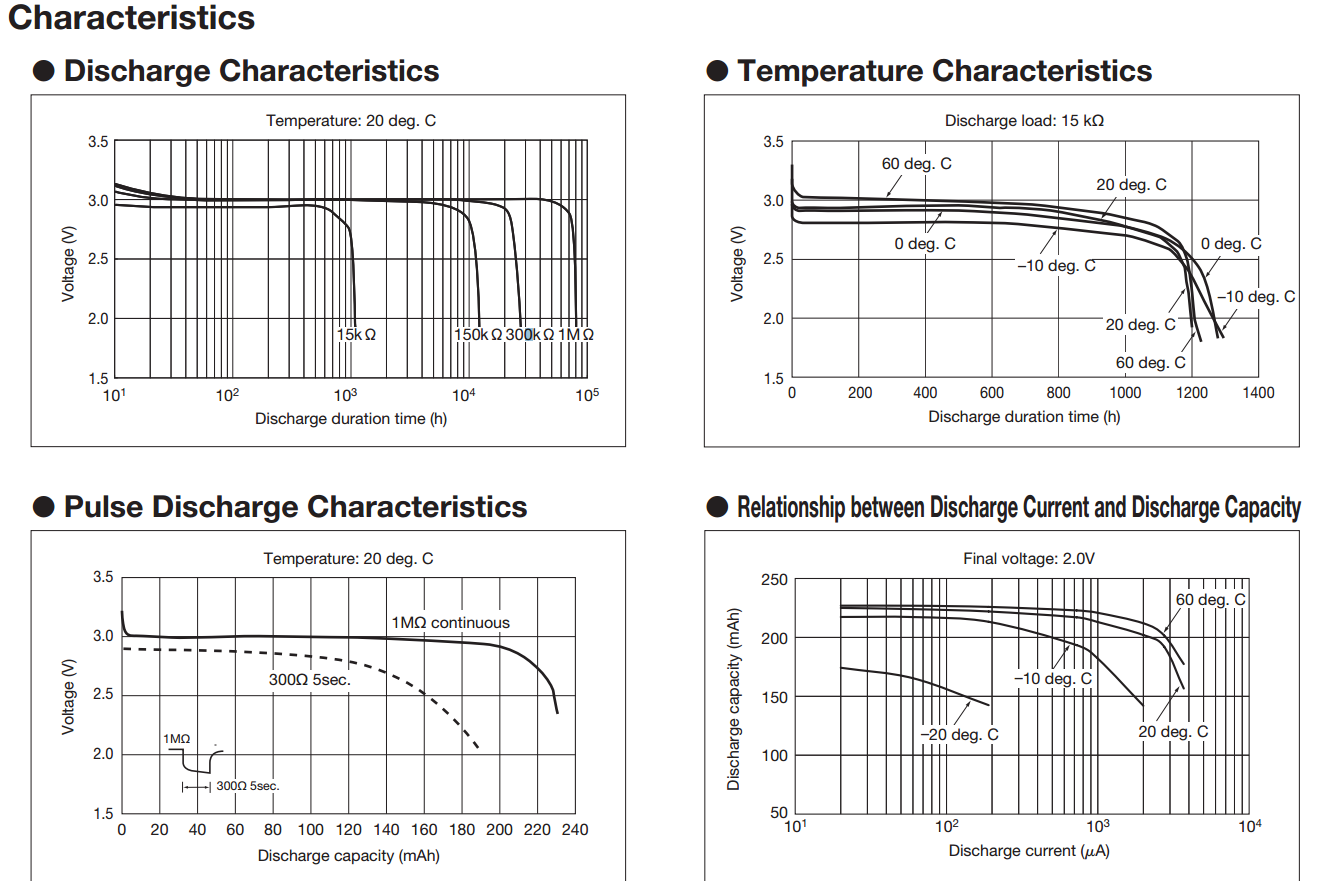
I found this website.
curve is shown below.

There are app_utils.h information below.
- @brief Function for converting the input voltage (in milli volts) into percentage of 3.0 Volts.
- @details The calculation is based on a linearized version of the battery's discharge
-
curve. 3.0V returns 100% battery level. The limit for power failure is 2.1V and -
is considered to be the lower boundary. -
The discharge curve for CR2032 is non-linear. In this model it is split into -
4 linear sections: -
- Section 1: 3.0V - 2.9V = 100% - 42% (58% drop on 100 mV) -
- Section 2: 2.9V - 2.74V = 42% - 18% (24% drop on 160 mV) -
- Section 3: 2.74V - 2.44V = 18% - 6% (12% drop on 300 mV) -
- Section 4: 2.44V - 2.1V = 6% - 0% (6% drop on 340 mV) -
These numbers are by no means accurate. Temperature and -
load in the actual application is not accounted for! - @param[in] mvolts The voltage in mV
- @return Battery level in percent.
I don't understand the above graph look.
How can I split like a source in the app_utils.h?
What are criteria divides?
And can you analyze that graph?
If you analyze, what should I do?
Or is there another way?
Oh.. I use CR2032. I would like to know how to use, even if the other batteries ago.


