This post is older than 2 years and might not be relevant anymore
More Info: Consider searching for newer posts

Radio Buffer's filling up faster then they should NRF_ERROR_RESOURCES on a sd_ble_gatts_hvx(..)

I have a sensor which I'm grabbing FIFO data from every 14msec,  ~240bytes.   I send these FIFO grabs as soon as they arrive. 

My connection parameters:

Connection Interval: 10msec

MTU = 247

DL=251

hvn_tx_queue_size = 36 

event_length = tried 8 ~ 18

PHY = tested both 1Mbps and 2Mbps

According to the timing, the FIFO data grabs occur every 14msec, so under the Connection interval.  Therefore the Buffers should never fill up.  However after about 200 data sends I get the NRF_ERROR_RESOURCES error.  Is there a setting I'm missing, why would the Radio be throttling?  If the MTU is 247 and Interval 10msec, assuming single packet in a Connection Event it should support up to 24kB/sec (with 240byte payloads).  According to the FIFO data grab date it only needs ~17.2kB/sec.  So where am I missing something that would cause the link not to be able to support the Data Rate and hit Buffer FULL errors?    I do handle this by wait on the BLE_GATTS_EVT_HVN_TX_COMPLETE but I don't want to lose any incoming data.

I'm currently using an nRF52840, SDK 16, S140 v7.0.1

Thanks for the help guys,

DC

Parents Reply Children
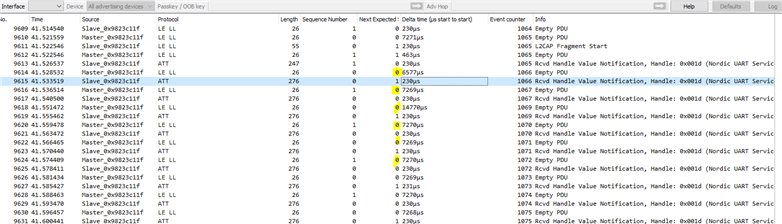
  • Looking at the PCA10059 Trace you can see once the Data Transmissions over the NUS Rx char start there is a Notification Send every 12~14msec as expected.  The payload should be 243bytes grabbed from an IMU FIFO.  However once I hit the first NRF_ERROR_RESOURCES @41.526 and enter my wait loop,  this loop iterates at the Connection Interval (7.5msec) and seems to keep resending the same payload.  Since my system never receives the BLE_GATTS_EVT_HVN_TX_COMPLETE event this loop spins forever.  So the underlying issue is eventually the BLE_GATTS_EVT_HVN_TX_COMPLETE event stops firing.   Could this be an issue due to using FreeRTOS?  I see that under the hood it uses Event Polling for Stack events rather than interrupts.  I manually set the SDH task priority to assure its the highest in the system (currently at 10).  Also note all my data sends are from Task context of a task with Priority 6 (lower than the SDH task).

  • I'm curious, 10? Is that really the highest priority, not a low priority? I wasn't following the thread in detail, but this is a bit unclear, what does "its" refer to, SDH or FreeRTOS?:

    " I manually set the SDH task priority to assure its the highest in the system"

    #elif __CORTEX_M == (0x04U)
    #define _PRIO_SD_HIGH       0
    #define _PRIO_SD_MID        1
    #define _PRIO_APP_HIGH      2
    #define _PRIO_APP_MID       3
    #define _PRIO_SD_LOW        4
    #define _PRIO_SD_LOWEST     5
    #define _PRIO_APP_LOW       6
    #define _PRIO_APP_LOWEST    7
    #define _PRIO_THREAD        15
    #else

  • What you are referring to is ARM interrupt priority which is a different (opposite) schema from FreeRTOS Thread Priority.  In freeRTOS higher priority value = higher priority.   Its the opposite in ARM IRQ priority setting.

  • Hi Dave, 

    Having a look at 41.526 I can see that it was the PCA10059 NACKed the notification from the DUT. 

    You can find the NESN (Next expected sequence number) of the packets from PCA10059 remains at 0 in all the packet after 41.526. ( I have some explanation on how to read SN and NESN here at the bottom of  the blog). 
    This explain why you see the DUT sending same notification after that, when a packet is NACKed, the device need to resend the same data again. 

    So the issue might not be on the DUT but on the PCA10059. This may explain why you don't see the issue when testing with the Samsung tab. 

    So we need to look into what you run on the PCA10059, there could be a chance that we have an overflow on the dongle. If the RX buffer on the dongle is full and the application doesn't pull the data out, the dongle will start nacking. 

    This happened at the same time when we receive a "L2CAP fragment start" so I'm not 100% if that the cause of the issue. If you can capture some other traces we can check the pattern and see if it's the cause. However, there were several L2CAP fragment packets before and it worked fine so I don't think it's the problem. 

Related